Today I’ll show you how to utilize Traefik locally with Kubernetes ☸️ to publish services using route matching and middlewares in an excellent approach.
Requirements
We require K3s to run containers locally; if you want an introduction, I wrote the following articles:
Using K3s to create a local Kubernetes environment
We could also use minikube, but it didn’t function well with Traefik when I tried to install CRDS and use middleware, so I’ll look into it in another post.
Podman lover ❤️?
If you enjoy Podman, this is for you. Take a look after this post if you want to use podman instead of Kubernetes ☸️.
Running the Traefik, my favorite Edge Router with Podman
What is Traefik?
Traefik is a modern HTTP reverse proxy and load balancer developed in Go that is suited for microservice architecture. It is commonly used in containerized environments, such as Docker and Kubernetes.
Traefik dynamically detects services as they are introduced to the infrastructure and routes traffic to them, making applications easier to manage and grow.
Major features:
- Automatic Service Discovery: Traefik can detect new services as they are introduced to your infrastructure, removing the need for human configuration.
- Dynamic Configuration: It can reorganize itself as services scale up or down, making it ideal for dynamic contexts like as container orchestration platforms.
- Load Balancing: Traefik includes built-in load balancing capabilities for distributing incoming traffic over many instances of a service.
- Automatic TLS: It may supply TLS certificates from Let’s Encrypt, enabling HTTPS by default without requiring manual configuration.
- Dashboard: Traefik includes a web dashboard and a RESTful API, which enable operators to monitor and manage traffic routing and configuration.
- Middleware Support: It supports a number of middleware plugins for features like authentication, rate limiting, and request rewriting.
- Multiple Backends:Traefik can route traffic to multiple backend services based on various criteria like path, headers, or domain names.
Goals 🎯
The goal is to create an example of using K3s to offer a node Kubernetes with Traefik; after provisioning, we will launch apps at ingress while enabling some Traefik middleware, demonstrating its true power 🔥.
K3s uses Traefik as the routing edge by default, so all you need to do is configure services and modify deployments.
🔥 Brace yourselves, deploy is coming…

Setting Up k3s with Traefik
Firstly, ensuring that K3s and Traefik are running:
sudo systemctl start k3s

sudo systemctl status k3s
#  Active: active (running)
Let us check to see whether pods are running properly.
kubectl get pods -A
kube-system   coredns-ccb96694c-h6rp6                   1/1     Running     0          30h
kube-system   helm-install-traefik-crd-hskk6            0/1     Completed   0          30h
kube-system   helm-install-traefik-svhhm                0/1     Completed   1          30h
kube-system   local-path-provisioner-5cf85fd84d-p44gg   1/1     Running     0          30h
kube-system   metrics-server-5985cbc9d7-9wfgz           1/1     Running     0          30h
kube-system   svclb-traefik-42c2404f-kvm8r              3/3     Running     0          93s
kube-system   traefik-5d45fc8cc9-2gxwm                  1/1     Running     0          30h
Then let’s check HTTP requests to Traefik; it should return 404 because there is no service routed at ingress.
curl http://localhost
# 404 page not found
Setting up local domains
Please adds to /etc/hosts file, the domains (whoami.local-k3s and traefik.local-k3s)
echo "127.0.0.1 whoami.local-k3s traefik.local-k3s" | sudo tee -a /etc/hosts
Deploying WhoAmI
Now it’s time to set up a basic pod that I used in a previous post to respond to HTTP requests and allow us to understand how the Kubernetes ☸️ stack works.
Let’s create some yaml files:
- whoami-middleware.yaml
This file defines a middleware that will be used in a Kubernetes service. The middleware adds a custom header to any request containing the header X-Origin.
apiVersion: traefik.containo.us/v1alpha1
kind: Middleware
metadata:
  name: whoami-response-headers
  namespace: default
spec:
  headers:
    customRequestHeaders:
      X-Origin: "whoami-kubernetes-local"
- whoami-deployment.yaml
That file describes two components: Kubernetes ☸️ service and deployment. The pod uses port 80, and the service is the same, with only one replica.
apiVersion: v1
kind: Service
metadata:
  name: whoami
  namespace: default
spec:
  ports:
    - port: 80
      targetPort: 80
  selector:
    app: whoami
---
apiVersion: apps/v1
kind: Deployment
metadata:
  name: whoami
  namespace: default
spec:
  replicas: 1
  selector:
    matchLabels:
      app: whoami
  template:
    metadata:
      labels:
        app: whoami
    spec:
      containers:
      - name: whoami
        image: traefik/whoami
        ports:
        - containerPort: 80
- whoami-ingress.yaml
Here we apply the rules to ingress find our service; this match uses the host as a rule and applies the previously established middleware.
apiVersion: traefik.containo.us/v1alpha1
kind: IngressRoute
metadata:
  name: whoami
  namespace: default
spec:
  entryPoints:
    - web
  routes:
  - match: Host(`whoami.local-k3s`)
    kind: Rule
    services:
      - name: whoami
        port: 80
    middlewares:
      - name: whoami-response-headers
Now, let’s put these definitions into action!
kubectl apply -f whoami-deployment.yaml \
              -f whoami-middleware.yaml \
              -f whoami-ingress.yaml
Expected response:
service/whoami created
deployment.apps/whoami created
middleware.traefik.containo.us/whoami-response-headers created
ingressroute.traefik.containo.us/whoami created
If everything goes well, we will be able to connect to your service via host on port 80 http://whoami.local-k3s/.
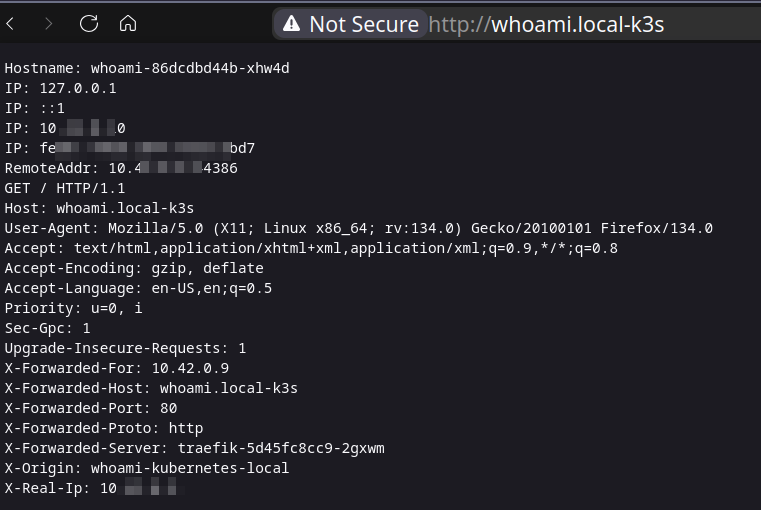
As we can see, when X-Origin is applied to a request, whoami returns all http request headers, which is great for testing 🚀.
Deploying the Traefik Dashboard
The Traefik Dashboard gives real-time visibility into your Kubernetes ☸️ ingress routes, services, and middleware. You may monitor active routes, examine the status of load balancing, and validate middleware setups such as authentication and header updates. It also lets you inspect TLS certificates, monitor backend health, and troubleshoot routing difficulties. You can improve security by protecting the dashboard with Basic Authentication or other access constraints.
Here I’ll show you how to enable Traefik Dashboard. By default, there is no authentication, so it’s not a good idea to enable at ingress without some security; my proposal is that this type of tool have limited access to a VPN or IP allow list.
Patch Traefik Services
K3s does not expose port 9000 at service, which is required for API and dashboard, therefore we need to patch.
- traefik-service-patch.yaml
spec:
  ports:
    - name: web
      nodePort: 32227
      port: 80
      protocol: TCP
      targetPort: web
    - name: websecure
      nodePort: 30411
      port: 443
      protocol: TCP
      targetPort: websecure
    - name: traefik
      port: 9000
      protocol: TCP
      targetPort: traefik
The following command applies the patch to the Traefik service that is currently running:
kubectl patch service traefik -n kube-system --patch "$(cat traefik-service-patch.yaml)"
Let’s inspect the port listening:
kubectl get services -n kube-system
The expected result:
NAME             TYPE           CLUSTER-IP     EXTERNAL-IP   PORT(S)                                     AGE
kube-dns         ClusterIP      10.43.0.10     <none>        53/UDP,53/TCP,9153/TCP                      31h
metrics-server   ClusterIP      10.43.228.25   <none>        443/TCP                                     31h
traefik          LoadBalancer   10.43.67.137   10.0.0.143    80:32227/TCP,443:30411/TCP,9000:31979/TCP   31h
We now need some files to route Traefik Dasboard across ingress in secure mode.
- traefik-auth-middleware.yaml
This file defines the middleware HTTP basic authentication.
apiVersion: traefik.containo.us/v1alpha1
kind: Middleware
metadata:
  name: traefik-dashboard-auth-middleware
  namespace: default
spec:
  basicAuth:
    secret: traefik-dashboard-auth-secret
- traefik-secret.yaml
We define the value of HTTP basic authentication, which represents user: foo and password: bar. Please do not use this in production 😂 since it is very powerful 💪.
apiVersion: v1
kind: Secret
metadata:
  name: traefik-dashboard-auth-secret
  namespace: default
data:
  users: Zm9vOntTSEF9WXMyM0FnLzVJT1dxWkN3OVFHYVZEZEh3SDAwPQo=
- traefik-dashboard-ingress.yaml
As with the previous ingress route, the match is made by host and is now protected by middleware HTTP basic authentication.
apiVersion: traefik.containo.us/v1alpha1
kind: IngressRoute
metadata:
  name: traefik-dashboard
  namespace: default
spec:
  entryPoints:
    - web
  routes:
    - match: Host(`traefik.local-k3s`)
      kind: Rule
      middlewares:
        - name: traefik-dashboard-auth-middleware
          namespace: default
      services:
        - name: api@internal
          kind: TraefikService
It’s time to put these definitions into practice!
kubectl apply -f traefik-auth-middleware.yaml \
              -f traefik-secret.yaml \
              -f traefik-dashboard-ingress.yaml
Expected result:
middleware.traefik.containo.us/traefik-dashboard-auth-middleware created
secret/traefik-dashboard-auth-secret created
ingressroute.traefik.containo.us/traefik-dashboard created
Now we can access the Dashboard (http://traefik.local-k3s), but it is secured by the HTTP basic authentication credentials foo:bar.
 It works, but I would never propose making this access public; instead, use a VPN to protect yourself 🧐.
Another ways to enable Dashboard
Using forward
This method allows you to route the Traefik and access the dashboard at port 9000, but keep in mind that there is no authentication. This command is running in the foreground, therefore closing the terminal will cause the forward to stop.
kubectl port-forward -n kube-system deployment/traefik 9000:9000
Editing service to expose port 9000 (manually)
The following command will edit the service with a file, which is handy for local testing.
kubectl edit services traefik -n kube-system
Adding these specifications, port 9000 will be listening:
spec:
    ports:
    - name: traefik
      port: 9000
      targetPort: 9000
Works, however there is no authentication, therefore it is not ready for production. 😉
Code
💡 Feel free to clone this repository, which contains related files: source
That’s all
In this post, we set up a Traefik-routed service over Ingress, and I demonstrate how to enable the Traefik dashboard in a variety of ways, the most significant of which is in a secure way, avoiding any issues caused by exposing your settings.
I hope this article helps you create your Kubernetes ☸️ stack with Traefik, and I’d love ❤️ to hear 👂 your questions or share your experiences, that’s it.

Don’t forget to upgrade your kernel 🧠; God bless 🕊️ you and your family.