
Previously, deploying applications was as simple as hosting them on a server or a single workstation. We relied on solutions such as Apache and IIS, mostly resolving issues or patching vulnerabilities via updates and hotfixes 🧪. However, things have changed dramatically since 2010—14 years ago—when organizations started to move from traditional VPS installations to cloud-based solutions. This change obviously enhanced security and operational efficiency, but it has also introduced additional challenges and vulnerabilities.
Today, the deployment process is more structured and sophisticated. We're no longer merely delivering applications; we need to understand their precise requirements, the versions in use, and all of their dependencies. This move has made our work more formal and hard, as administering new apps necessitates an extensive knowledge of their architecture and context.
Table of Contents
- Introduction
- Why Container Security Matter?
- What is Trivy?
- Setting Up Trivy in GitHub Actions
- Best Practices
- Code
- Conclusion
Why Container Security Matter?
Just like an NPM package is created every second, I could argue that CVEs emerge just as quickly—maybe not in a second, but certainly fast. These vulnerabilities emerge to help us identify risks and resolve them before they escalate into serious problems.
A CVE (Common Vulnerabilities and Exposures) is a list of publicly known security vulnerabilities that exist in software or hardware. Each CVE has a unique ID and specifies a specific vulnerability, allowing businesses to discover and address security vulnerabilities before they are exploited.
This table contains a variety of significant software that has had notable CVEs:
| Rank | Software | Number of CVEs | Notable Vulnerability Example | Description |
|---|---|---|---|---|
| 1 | Linux Kernel | 1000+ | CVE-2020-25712 (Privilege Escalation) | A core part of many operating systems, the Linux kernel often has numerous vulnerabilities related to hardware interfaces and memory management. |
| 2 | Apache HTTP Server | 400+ | CVE-2017-15715 (Remote Code Execution) | A widely used web server, Apache HTTP Server frequently faces vulnerabilities related to web protocols and server misconfigurations. |
| 3 | WordPress | 500+ | CVE-2018-6389 (Cross-Site Scripting) | Popular CMS with numerous plugins and themes, leading to many security flaws that can affect websites and user data. |
| 4 | OpenSSL | 200+ | CVE-2014-0160 (Heartbleed) | Provides cryptographic functions to many systems; vulnerabilities often involve weak encryption or improper handling of secure communications. |
| 5 | Microsoft Windows | 1000+ | CVE-2020-0601 (Cryptographic Issue) | The world’s most widely used OS has long been a target for a broad range of exploits across services and applications. |
| 6 | Java (JDK) | 1000+ | CVE-2016-0603 (Remote Code Execution) | The Java Development Kit has many vulnerabilities, especially in its older versions, affecting enterprise software globally. |
| 7 | Docker | 100+ | CVE-2019-5736 (Privilege Escalation) | As the leading containerization tool, Docker has numerous vulnerabilities in container security and Docker daemon configurations. |
| 8 | Node.js | 150+ | CVE-2018-12115 (Denial of Service) | Node.js, as a runtime for JavaScript, often has CVEs related to dependency management and security flaws in asynchronous code execution. |
| 9 | Adobe Flash | 800+ | CVE-2015-0313 (Remote Code Execution) | Although no longer supported, Flash once had numerous security issues, often involving memory corruption and exploits via web browsers. |
| 10 | Python | 200+ | CVE-2018-1000800 (Arbitrary Code Execution) | Python’s broad usage across web apps and server environments has made it a common target for vulnerabilities, especially in third-party libraries. |
As you can see, the various components of the programs you develop or use as services frequently have a large number of known vulnerabilities. This makes it essential to frequently check for updates and ensure that your services and applications are patched as soon as possible. Failure to do so could result in major problems, particularly when essential applications are in production and adding value to your business. Without regular maintenance, you risk an unexpected failure 💥 that could disrupt operations at any moment.

Fortunately, CVE fixes have significantly improved from 2024 to 2025. It’s clear that both organizations and individual developers are increasingly focused on resolving vulnerabilities, aiming to reduce risk and ensure smoother operations. This progress allows for more ☕ coffee time without worrying about critical security gaps. We can only hope that this positive trend continues as we move forward.

What is Trivy?
In terms of security, Trivy offers an effective solution for checking your container images on a regular basis for vulnerabilities. However, as self-hosted applications gain popularity, there is a growing trend of exposing ports for communication via HTTP, UDP, TCP, gRPC, and other protocols, providing interaction with both internal and external systems. This change adds new complexity to securing not only container images but also communication links between services. So exploits became common, turning this into an acknowledged vulnerability.
Trivy also monitors your IaC for missing setups, which might lead to vulnerabilities. For example, a Kubernetes deployment with unchecked container capabilities can be vulnerable to exploits.
Trivy, developed by Aqua Security, is a popular open-source vulnerability scanner designed for modern DevSecOps workflows. Its standout qualities — speed, simplicity, and comprehensive coverage — make it a preferred choice among developers and security professionals alike.
⚡ Fast scanning.
Trivy is designed for performance. It runs rapid scans by caching results locally and utilizing little system resources. This makes it appropriate not only for CI/CD pipelines, but also for local development environments where developers want rapid feedback.
- Low latency: Initial scans download vulnerability databases; subsequent scans are nearly instant.
- Optimized for CI/CD: Integrates easily with GitHub Actions, GitLab CI, Jenkins, and other tools.
🧩 Simple to use.
One of Trivy's most significant advantages is its ease of use, from installation to execution.
A single binary requires no complex setup. Simply install and start.
Straightforward CLI: A developer-friendly interface that does not require security knowledge.
Quick onboarding: Teams can begin scanning in minutes.
trivy image nginx:latest

# or with docker

docker run --rm -v /var/run/docker.sock:/var/run/docker.sock aquasec/trivy image nginx:latest
🔐 Comprehensive Scanning Capabilities
Trivy isn't only for container images. It supports a wide range of targets, making it an adaptable tool for safeguarding infrastructure and applications from beginning to finish.
- Container Images (Docker, Podman)
- Operating System Packages (Debian, Alpine, etc.)
- Infrastructure as Code (IaC) (Terraform, Kubernetes manifests, Helm)
- Source Code Repositories
- SBOM (Software Bill of Materials) support
- Git repositories (local or remote)
With Trivy, you can detect:
- CVEs (Common Vulnerabilities and Exposures)
- Misconfigurations
- Secrets (API keys, tokens)
- License compliance issues
🔄 Shift Left Friendly
Trivy enables teams to take a "shift-left" security approach, detecting risks early in the development process before they reach production. This results in fewer surprises and less security debt.
📦 Example Use Cases
- Scan a Docker image for known vulnerabilities
- Audit a Kubernetes YAML file for insecure defaults
- Validate Terraform infrastructure for misconfigurations
- Check for exposed secrets in your Git repo
In short, Trivy offers a uniform toolkit for scanning across the software lifecycle, delivering useful information at a minimal overhead. Whether you're developing microservices or managing cloud-native infrastructure, Trivy keeps your stack secure without slowing you down.
Setting Up Trivy in GitHub Actions
Let's create a CI pipeline that uses GitHub Actions to run Trivy on each contribution. This allows us to detect and avoid important security issues before they reach production.
In a fast-paced development environment, it's tempting to become excited about releasing new features — but it's also crucial to remember that insecure code can harm the business, users, and your team. So, take responsibility for your code's security: avoid older or unmaintained packages, don't introduce untrusted dependencies, and always think before installing.
Security is not simple, but it is your responsibility, and I believe in you. Let's create safer software one commit at a time.

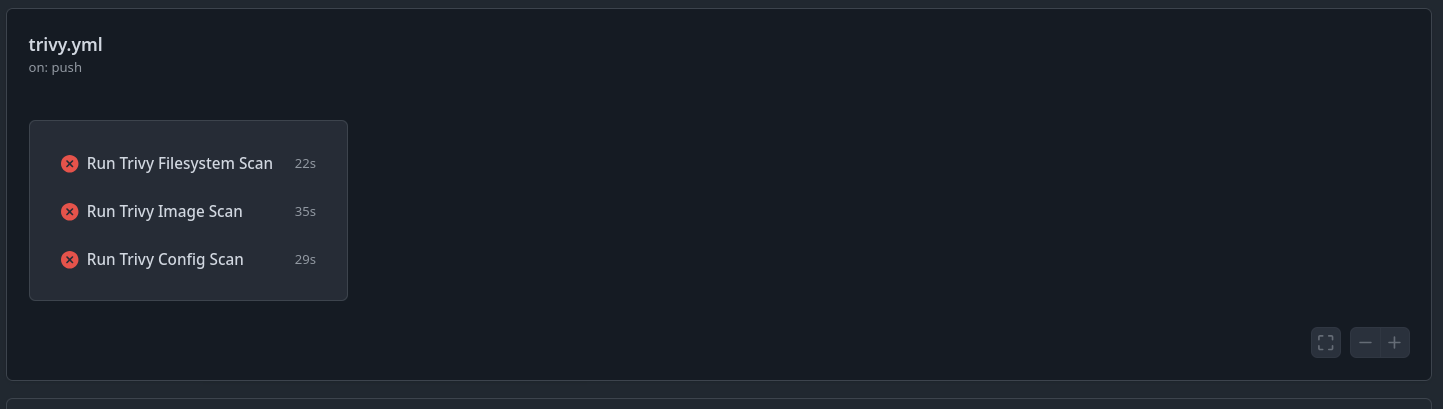
Here's a GitHub Actions workflow to execute Trivy on any pushed commit:
name: Trivy Scan

on:
  push:
    branches: [ "main" ]
  pull_request:
    branches: [ "main" ]

permissions:
  contents: read

jobs:
  fs-scan:
    runs-on: ubuntu-latest
    name: Run Trivy Filesystem Scan
    steps:
    - name: Checkout code
      uses: actions/checkout@v3

    - name: Run Trivy vulnerability scanner in fs mode
      uses: aquasecurity/trivy-action@master
      with:
        scan-type: 'fs'
        scan-ref: '.'
        trivy-config: trivy/trivy.yaml
        severity: 'HIGH,CRITICAL'
        exit-code: 2

  image-scan:
    runs-on: ubuntu-latest
    name: Run Trivy Image Scan
    steps:
    - name: Checkout code
      uses: actions/checkout@v3

    - name: Build Docker image
      run: docker build -f Containerfile -t local-nginx .

    - name: Run Trivy vulnerability scanner in image mode
      uses: aquasecurity/trivy-action@master
      with:
        scan-type: 'image'
        image-ref: 'local-nginx'
        trivy-config: trivy/trivy.yaml
        severity: 'HIGH,CRITICAL'
        exit-code: 2

  config-scan:
    runs-on: ubuntu-latest
    name: Run Trivy Config Scan
    steps:
    - name: Checkout code
      uses: actions/checkout@v3

    - name: Run Trivy vulnerability scanner in config mode
      uses: aquasecurity/trivy-action@master
      with:
        scan-type: 'config'
        scan-ref: '.'
        trivy-config: trivy/trivy.yaml
        severity: 'HIGH,CRITICAL'
        exit-code: 2
As you can see, I utilized three scanning methods: fs to scan the local file system directory and image to scan a custom container image that was created and made available locally and config to scan IaC.
The Trivy file settings (trivy.yaml):
severity:
  - HIGH
  - CRITICAL

ignore-unfixed: true

ignore:
  vulnerabilities:
    - CVE-2021-12345
    - CVE-2022-67890

output:
  format: table

scan:
  config:
    enabled: true
  secrets:
    enabled: true
  iac:
    enabled: true
    policies:
      - terraform
      - kubernetes

timeout: 5m
- severity: Defines the severity levels that your scan will treat as vulnerabilities.
- ignore: This section allows you to specify which CVEs to bypass during the scan, but use with caution as it’s at your own risk.
- scan: Here, you can choose the type of scans to run, such as scanning Docker images, file systems, or Infrastructure as Code (IaC).
🧪 Output (trimmed)
Here, we have the outputs from Trivy for three different types of scans: container image, file system, and Infrastructure as Code (IaC).
I created files with vulnerabilities to demonstrate Trivy in action. These include insecure IaC, secrets exposed in a file, and a vulnerable container image.
Report Summary

┌─────────────────────────────┬────────┬─────────────────┬─────────┐
│           Target            │  Type  │ Vulnerabilities │ Secrets │
├─────────────────────────────┼────────┼─────────────────┼─────────┤
│ nginx:latest (debian 12.10) │ debian │       154       │    -    │
└─────────────────────────────┴────────┴─────────────────┴─────────┘

Legend:
- '-': Not scanned
- '0': Clean (no security findings detected)


nginx:latest (debian 12.10)

Total: 154 (UNKNOWN: 2, LOW: 99, MEDIUM: 39, HIGH: 12, CRITICAL: 2)


┌────────────────────┬─────────────────────┬──────────┬──────────────┬─────────────────────────┬───────────────┬──────────────────────────────────────────────────────────────┐
│      Library       │    Vulnerability    │ Severity │    Status    │    Installed Version    │ Fixed Version │                            Title                             │
├────────────────────┼─────────────────────┼──────────┼──────────────┼─────────────────────────┼───────────────┼──────────────────────────────────────────────────────────────┤
│ apt                │ CVE-2011-3374       │ LOW      │ affected     │ 2.6.1                   │               │ It was found that apt-key in apt, all versions, do not       │
│                    │                     │          │              │                         │               │ correctly...                                                 │
│                    │                     │          │              │                         │               │ https://avd.aquasec.com/nvd/cve-2011-3374                    │

AVD-AWS-0132 (HIGH): Bucket does not encrypt data with a customer managed key.
═══════════════════════════════════════════════════════════════════
Encryption using AWS keys provides protection for your S3 buckets. To increase control of the encryption and manage factors like rotation use customer managed keys.


See https://avd.aquasec.com/misconfig/avd-aws-0132
───────────────────────────────────────────────────────────────────
 trivy/example.tf:24-31
───────────────────────────────────────────────────────────────────
  24 ┌ resource "aws_s3_bucket" "insecure_bucket" {
  25 │   bucket = "insecure-bucket-example"
  26 │   acl    = "public-read"
  27 │
  28 │   versioning {
  29 │     enabled = false
  30 │   }
  31 └ }

AVD-KSV-0014 (HIGH): Container 'vulnerable-container' of Deployment 'vulnerable-deployment' should set 'securityContext.readOnlyRootFilesystem' to true
═══════════════════════════════════════════════════════════════════
An immutable root file system prevents applications from writing to their local disk. This can limit intrusions, as attackers will not be able to tamper with the file system or write foreign executables to disk.

See https://avd.aquasec.com/misconfig/ksv014
───────────────────────────────────────────────────────────────────
 trivy/deployment.yml:18-34
───────────────────────────────────────────────────────────────────
  18 ┌       - name: vulnerable-container
  19 │         image: nginx:1.16
  20 │         ports:
  21 │         - containerPort: 80
  22 │         env:
  23 │         - name: SECRET_KEY
  24 │           value: "hardcoded-secret"
  25 │         securityContext:
  26 └           privileged: true

HIGH: AsymmetricPrivateKey (private-key)
════════════════════════════════════════════════════════════════════════════════════════════════════════════════════════════════
Asymmetric Private Key
────────────────────────────────────────────────────────────────────────────────────────────────────────────────────────────────
 trivy/secrets.txt:10
────────────────────────────────────────────────────────────────────────────────────────────────────────────────────────────────
   8     "project_id": "fake-project-id",
   9     "private_key_id": "fakeprivatekeyid12345",
  10 [   "private_key": "-----BEGIN PRIVATE KEY-----******************-----END PRIVATE KEY-----\n",
  11     "client_email": "[email protected]",
────────────────────────────────────────────────────────────────────────────────────────────────────────────────────────────────
Trust me 🤝, you can check the results directly in the GitHub CI:
Best Practices
Frequent scans
Running vulnerability scans on each commit is secure, but it may be costly 💸🤑💰, particularly in businesses with hundreds of developers and several projects. Your CI pipeline may struggle under the pressure, affecting performance and developer productivity.
Instead, consider examining your CI phases and selecting the appropriate time to execute security tests. As your procedures evolve, you can use common, "pre-scanned" base images across projects to reduce scanning time while retaining a high level of security.
Prioritize high and critical vulnerabilities
Make sure your workflow fails when critical or high-severity vulnerabilities are discovered. Detecting vulnerabilities early is critical, but not every vulnerability should halt development. According to your risk tolerance and business environment, low or medium-level vulnerabilities may be acceptable, but don't wait until they reach high levels to pay attention 🧐.
It is critical to determine which severity levels are undesirable in production and which are manageable. This decision should be part of an ongoing, open discussion between 👨💻development and 👮security teams to find the correct balance between safety and productivity.
Regular updates
Keeping your base images and dependencies up to date is one of the best strategies to reduce vulnerabilities. Scanning helps you detect worries early on, but it's also critical to understand why those vulnerabilities exist in your stack.
For example, if your application depends on too many libraries, you run the danger of importing deprecated or unmaintained packages. In ecosystems like NPM, a single dependent might pull in dozens of transitive dependencies, sometimes for functionality you rarely use. In such circumstances, consider creating lightweight alternatives or including only what you require.
Be cautious of using trendy frameworks or libraries simply because they're popular. If they stop receiving updates or support from the community, you could be left with a security risk 🧠.
Don't make decisions based solely on emotions ❤️; remember the wisdom of this Bible verse:
Jeremiah 17:9 (NIV):
"The heart is deceitful above all things and beyond cure. Who can understand it?"
While solutions like Trivy promote a culture of regular updates, it is your obligation to ensure that your team avoids unmaintained or obsolete dependencies - prevention begins with smart choices.
Outputs on CI
Depending on your CI volume and team size, reviewing scan results immediately within the CI pipeline might be confusing and hard to read, making it 🥴 challenging for developers to identify and resolve vulnerabilities effectively.
To optimize this process, Trivy reports can be integrated with other tools, such as SonarQube, to improve the user experience, consolidate security issues, and provide more explicit solutions. This integration helps you organize vulnerability data, streamline issue tracking, and enable developers to focus on fixing significant problems rather than becoming lost in a sea of scan results.
Code
💡 Feel free to clone this repository, which contains related files:

Conclusion
That’s all for today, folks! I hope you enjoyed this quick dive into Trivy.
My goal was to raise awareness about security and share practical tools and best practices that you can apply in your daily development workflow.
Stay safe, write secure code, never stop learning and keep your kernel 🧠 up to date!

References
]]>☕ Pegue seu café e bora mergulhar no artigo!
Porque entender o que acontece com
Este artigo é pra você que quer entender a fundo aquela aplicação que misteriosamente começa a apresentar problemas... geralmente no fim da tarde de uma sexta-feira. Acertei? 😅
☕ Pegue seu café e bora mergulhar no artigo!
Porque entender o que acontece com sua aplicação antes do caos da sexta à tarde é sempre uma boa ideia. 😃
Guia de bordo
- Os 3 Pilares da Observabilidade
- O que é OpenTelemetry?
- Cloud Native Computing Foundation (CNCF)
- Benefícios do OpenTelemetry
- Entregando observabilidade
- Chega de Teoria, Vamos Codar!
- Configurando o OpenTelemetry
- Instrumentação
- Como testar?
- Conclusão
🧱 Os 3 Pilares da Observabilidade
A observabilidade moderna se apoia em três pilares principais:
- 📊 Métricas: mostram o estado da aplicação ao longo do tempo (como uso de CPU, requisições por segundo, latência etc.).
- 🧻 Logs: registram eventos e mensagens que ajudam a entender o que aconteceu em determinado momento.
- 🔍 Traces: acompanham o caminho de uma requisição de ponta a ponta, revelando gargalos e dependências entre serviços.
Juntos, esses três pilares ajudam a responder uma das perguntas mais importantes no dia a dia de quem opera sistemas: “Por que meu sistema está se comportando desse jeito?”
E é exatamente aí que o OpenTelemetry entra em cena — fornecendo as ferramentas necessárias para coletar, padronizar e correlacionar métricas, logs e traces, tudo em um único ecossistema.
O que é OpenTelemetry?
É uma iniciativa de código aberto que tem como objetivo estabelecer um padrão unificado para a coleta, o processamento e a exportação de dados de telemetria. Trata-se de uma solução completa para monitorar o desempenho, o comportamento e a saúde de aplicações e sistemas, oferecendo visibilidade total sobre o que está acontecendo em seu ambiente.
Cloud Native Computing Foundation (CNCF)
Se você já se perdeu no meio de logs, métricas e traces tentando entender o que tá pegando na sua aplicação, respira fundo — você não está sozinho. A boa notícia é que a galera da comunidade open source também sentia essa dor… e decidiu fazer algo a respeito.
Foi daí que nasceu o OpenTelemetry, uma ferramenta que veio ao mundo como resultado da união de dois projetos que já estavam mandando bem: OpenTracing e OpenCensus. Em vez de continuar com iniciativas separadas, a comunidade juntou forças 🔥 pra criar um padrão único e poderoso de observabilidade.
Essa fusão virou realidade e, em outubro de 2022, rolou o lançamento da primeira versão estável do OpenTelemetry. Desde então, o projeto só cresceu e virou queridinho de quem trabalha com sistemas distribuídos, microsserviços e Kubernetes.
E sabe o que é mais legal? O projeto é mantido pela Cloud Native Computing Foundation (CNCF) — a mesma galera por trás do Kubernetes, Prometheus, Envoy e outros pesos pesados do mundo cloud native.
Ou seja, se você quer observabilidade de verdade no seu sistema, sem gambiarra e com suporte da comunidade, o OpenTelemetry é o caminho.
Benefícios do OpenTelemetry
🔍 Visibilidade Aprimorada
Com o OpenTelemetry, você ganha olhos de águia sobre seus sistemas. É possível monitorar desempenho, comportamento e saúde em tempo real, o que significa que nada passa despercebido — de latências inesperadas a gargalos ocultos.
🛠️ Diagnóstico e Resolução de Problemas Sem Dor de Cabeça
Ao oferecer uma telemetria completa, padronizada e consistente, o OpenTelemetry facilita (e muito!) a identificação da raiz dos problemas. Isso se traduz em respostas mais rápidas, menos tempo de inatividade e menos estresse na madrugada.
📊 Decisões Guiadas por Dados Reais
Nada de achismos. Com dados confiáveis em mãos, fica mais fácil tomar decisões estratégicas: otimizar o desempenho da aplicação, identificar padrões de uso e até direcionar recursos com mais inteligência.
🔄 Interoperabilidade e Flexibilidade de Verdade
OpenTelemetry não te prende a nenhuma ferramenta específica. Ele é agnóstico de fornecedor, permitindo integração com diversos backends populares como Prometheus, Jaeger, Zipkin, Datadog, entre outros. Isso dá liberdade pra montar o stack de observabilidade que fizer mais sentido pro seu time
Principais recursos do OpenTelemetry
O OpenTelemetry oferece bibliotecas (SDKs) prontas para você instrumentar suas aplicações de forma simples e eficiente. Com elas, é possível coletar dados de telemetria como métricas, logs e traces, tudo de maneira padronizada.
⚒ Instrumentação
Esses SDKs são compatíveis com as principais linguagens de programação do mercado, incluindo C++, C#, Elixir, Go, Java, Lua, Ruby, Rust, Python e JavaScript, permitindo que você adote observabilidade de ponta a ponta, independentemente da stack que estiver usando.
🗑 Coleta e Processamento Inteligente
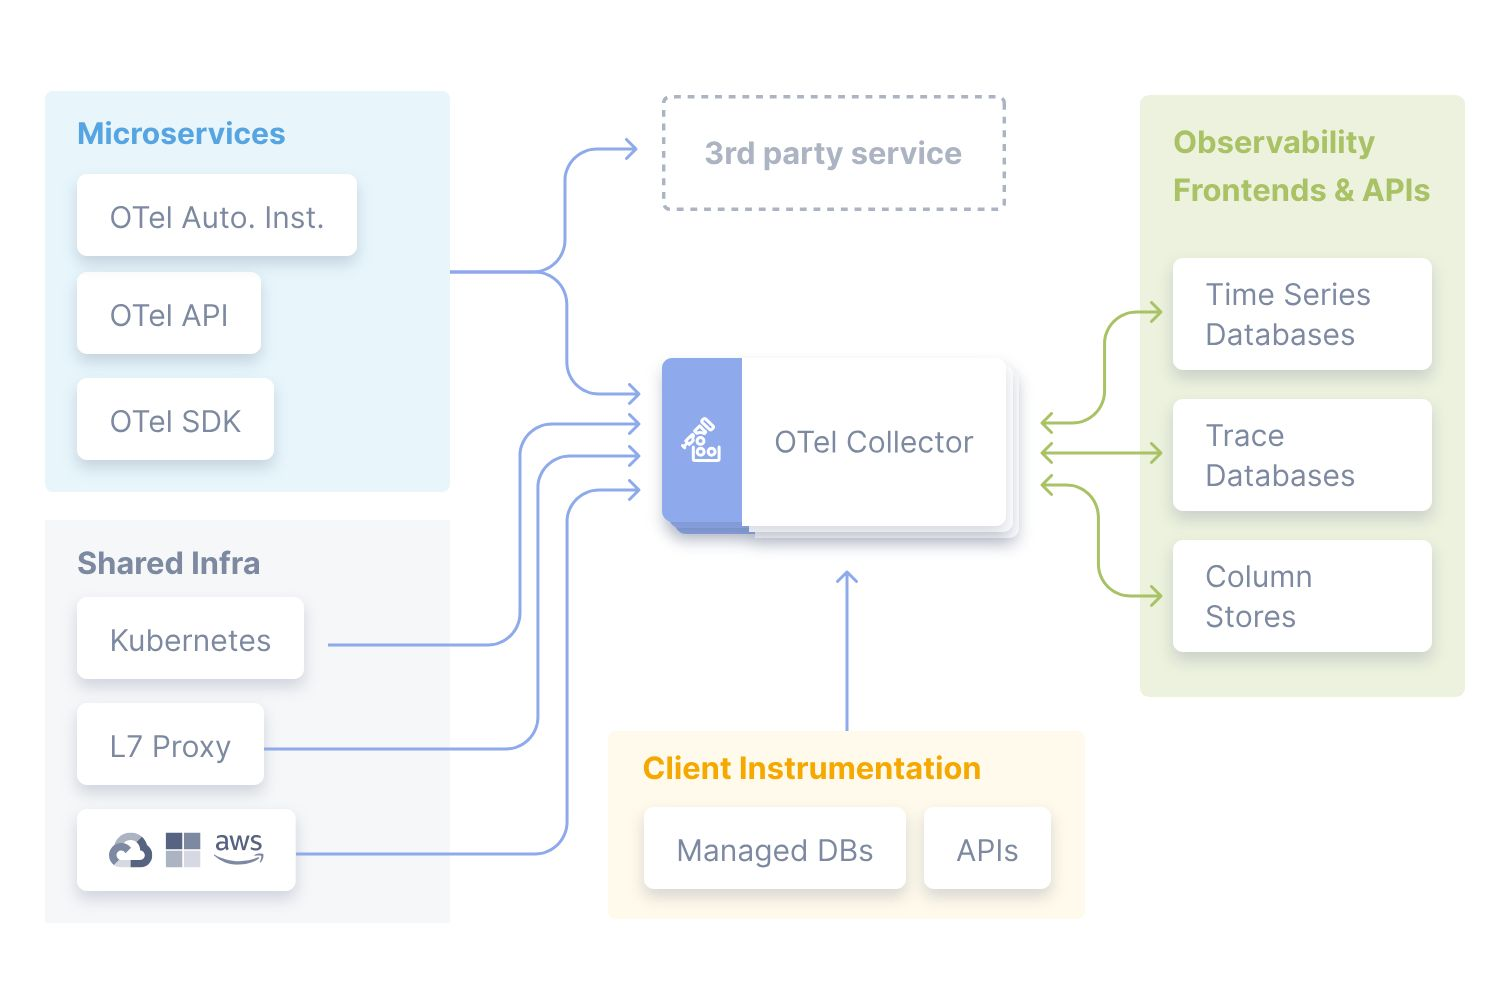
O OpenTelemetry conta com um coletor centralizado (o famoso OpenTelemetry Collector) que funciona como um hub de dados de telemetria. Ele recebe informações vindas de diversas fontes — como aplicações, agentes e sidecars — e faz o trabalho pesado: agrega, filtra, transforma e roteia esses dados antes de enviá-los para a ferramenta de análise ou observabilidade da sua escolha.
Com isso, você ganha mais controle, eficiência e flexibilidade, além de aliviar o trabalho das suas aplicações, que não precisam se preocupar com a exportação direta dos dados.
🚚 Exportação para Onde Você Quiser
Com o OpenTelemetry, seus dados não ficam presos em um lugar só. Ele suporta diversos backends de telemetria, permitindo que você exporte métricas, logs e traces para as plataformas de observabilidade e análise que já usa — como Prometheus, Jaeger, Zipkin, Datadog, New Relic, entre outros.
Essa flexibilidade garante que você possa escolher a melhor ferramenta para cada necessidade, sem abrir mão da padronização e consistência na coleta dos dados.

🧰 Componentes Essenciais do OpenTelemetry
🎯 Instrumentação
As bibliotecas de instrumentação são integradas diretamente às suas aplicações, permitindo a coleta automática (ou manual) de métricas, logs e traces. É com elas que você começa a dar visibilidade ao que acontece "debaixo do capô" dos seus serviços.
🗃️ Coletores (Collectors)
O OpenTelemetry Collector atua como uma central de inteligência: recebe dados de telemetria de múltiplas fontes, processa, transforma e filtra as informações antes de enviá-las aos destinos configurados. Ele alivia o trabalho das aplicações e garante mais controle sobre o fluxo dos dados.
📦 Exportadores (Exporters)
Os exportadores são responsáveis por enviar os dados processados para os backends de observabilidade. O OpenTelemetry já traz suporte a várias ferramentas populares, como Prometheus, Jaeger, Zipkin, Datadog, New Relic, entre outras.
📊 Backends de Telemetria
São as plataformas onde os dados ganham vida: eles armazenam, processam e visualizam as métricas, logs e traces coletados. É aqui que você consegue entender o desempenho, o comportamento e a saúde da sua aplicação com dashboards, alertas e análises avançadas.
🛡️ E os dados sensíveis? Relaxa, dá pra proteger!
Quando estamos lidando com dados sensíveis, como informações de cartão de crédito, CPF/CNPJ, e-mails ou qualquer outro dado pessoal, é essencial garantir que nada disso vaze nos seus traces.
Com o OpenTelemetry, é possível remover ou mascarar esses dados antes mesmo que eles sejam exportados, usando um componente chamado OTel Processor. Esse processador permite filtrar, anonimizar ou transformar campos específicos no pipeline de telemetria, garantindo conformidade com LGPD, GDPR e outras regulamentações de privacidade.
Ou seja, você continua com visibilidade total do sistema, mas sem comprometer a segurança e a privacidade dos seus usuários.
O que o OpenTelemetry coleta?
O OpenTelemetry (OTel) funciona como um verdadeiro detetive digital: ele coleta e exporta tudo o que você precisa saber sobre sua aplicação — sem complicar.
Como mencionamos anteriormente, ele se apoia nos três pilares da observabilidade:
📊 Métricas, 🧻 Logs e 🔍 Traces.
Suporte as linguagens
| Linguagem | Suporte OpenTelemetry | Estágio |
|---|---|---|
| Java | ✅ Sim | Estável |
| JavaScript (Node.js/Browser) | ✅ Sim | Estável |
| Python | ✅ Sim | Estável |
| Go | ✅ Sim | Estável |
| .NET (C#) | ✅ Sim | Estável |
| Ruby | ✅ Sim | Estável |
| C++ | ✅ Sim | Em evolução |
| PHP | ⚠️ Parcial | Em desenvolvimento |
| Rust | ⚠️ Parcial | Comunidade ativa |
| Swift | ⚠️ Parcial | Projeto comunitário |
| Erlang/Elixir | ⚠️ Parcial | Projeto comunitário |
🔎 Observação: As linguagens com suporte “parcial” ou “em desenvolvimento” ainda estão evoluindo ou são mantidas pela comunidade.
Entregando observabilidade
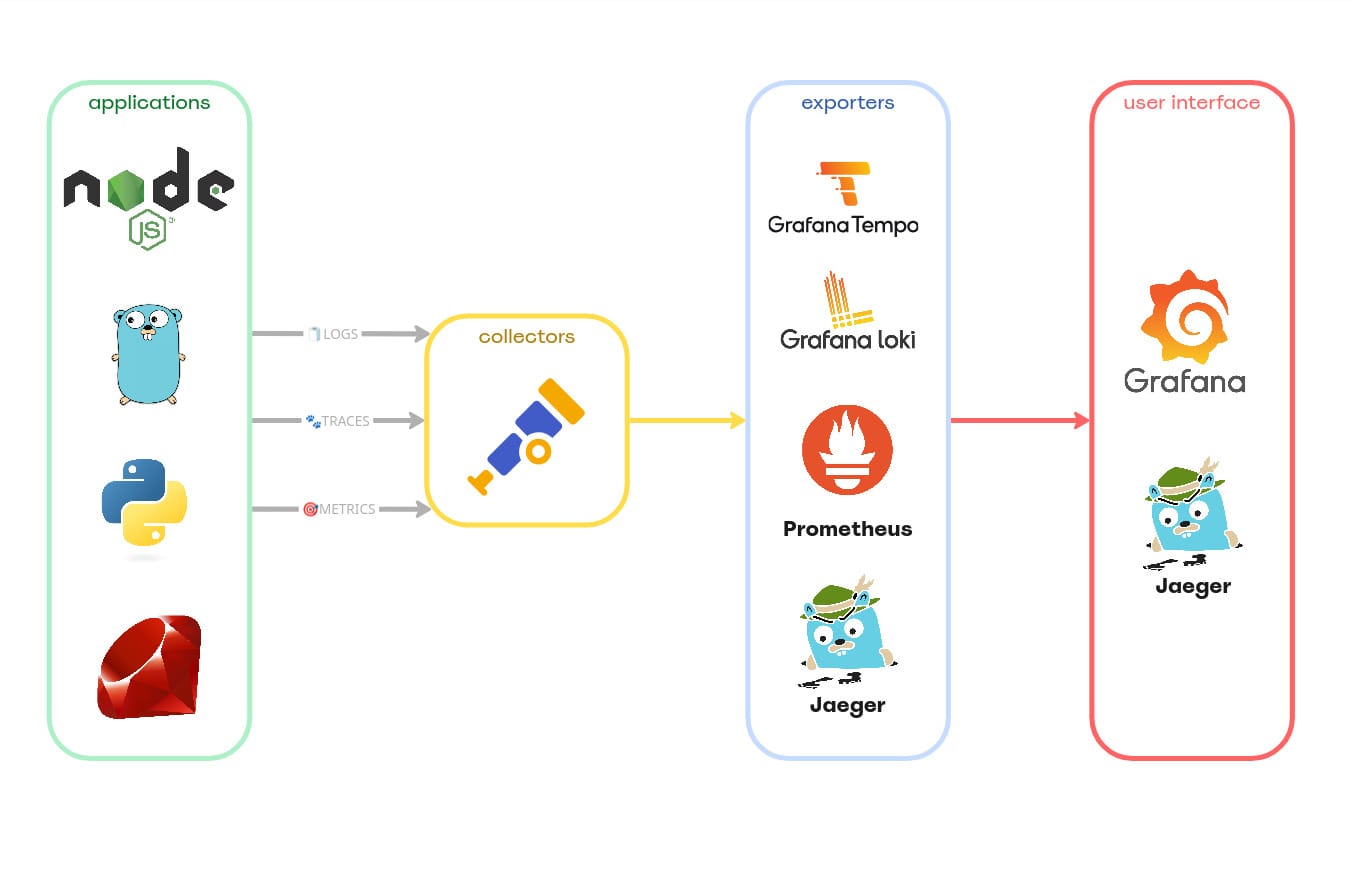
No diagrama acima, visualizamos as principais camadas de uma arquitetura de observabilidade. Iniciando pela camada das aplicações, que são as responsáveis por gerar os insumos fundamentais: logs, traces e métricas. Em seguida, entra o OpenTelemetry Collector, que atua como intermediário — ele recebe, processa e transforma esses dados, encaminhando-os para um ou mais exporters, que se encarregam de armazená-los ou redirecioná-los para ferramentas especializadas.
Por fim, temos a camada de apresentação, composta por interfaces de visualização (UIs), onde é possível construir dashboards, configurar alertas e executar queries sobre os dados coletados. Neste exemplo, usamos apenas duas ferramentas, mas a arquitetura é flexível e compatível com diversas soluções comerciais amplamente adotadas no mercado, como Datadog, New Relic, Kibana, entre outras.
Se o objetivo for algo mais simples, especialmente em ambientes de desenvolvimento, também é possível enviar os dados diretamente para o Jaeger, que oferece uma visualização prática e eficiente dos três pilares da observabilidade: métricas, logs e traces.
Chega de Teoria, Vamos Codar!
Há algum tempo, iniciei algumas POCs com o objetivo de descomplicar a instrumentação com OpenTelemetry em aplicações escritas nas diversas linguagens que compunham a stack com a qual eu estava trabalhando.
Durante esse processo, acabei mudando de empresa — mas continuei esse estudo, evoluindo a ideia e consolidando o aprendizado em uma apresentação resumida, que agora serve de base para este artigo.
Como mencionei antes, estamos lidando com várias linguagens, então a proposta aqui é mostrar rapidamente trechos de implementação, só pra dar o gostinho. E claro: o repositório com todos os exemplos está disponível — você pode clonar, testar e entender na prática como a instrumentação com OpenTelemetry funciona em cada caso:

Configurando o OpenTelemetry
A configuração do colector (OTel)
- otel-collector-config.yaml
# OpenTelemetry Collector config that receives OTLP
receivers:
  otlp:
    protocols:
      grpc:
        endpoint: "0.0.0.0:4317"
      http:
        endpoint: "0.0.0.0:4318"

processors:
  batch:
    send_batch_size: 1024
    timeout: 5s

  attributes/scrape:
    actions:
      - key: environment
        value: production
        action: insert

      - key: process.command_line
        action: delete
      - pattern: credit_card
        action: delete
      - pattern: password
        action: delete

      - pattern: email
        action: hash
      - pattern: vatnumber
        action: hash
      - pattern: document
        action: hash
      - pattern: x_secret_key
        action: hash

exporters:
  debug:
      verbosity: detailed

  otlp/jaeger:
    endpoint: jaeger:4317
    tls:
      insecure: true

  loki:
    endpoint: http://loki:3100/loki/api/v1/push

  prometheus:
    endpoint: 0.0.0.0:18888

  otlp/tempo:
    endpoint: tempo:4317
    tls:
      insecure: true

extensions:
  zpages: {}

service:
  extensions: [zpages]
  pipelines:
    traces:
      receivers: [otlp]
      processors: [attributes/scrape, batch]
      exporters: [otlp/jaeger, otlp/tempo]
    metrics:
      receivers: [otlp]
      processors: [attributes/scrape, batch]
      exporters: [prometheus]
    logs:
      receivers: [otlp]
      processors: [attributes/scrape, batch]
      exporters: [loki]
Nesta configuração, o OpenTelemetry Collector não se limita apenas à coleta de dados — também configuramos etapas de processamento para demonstrar todo o potencial da ferramenta. O objetivo é mostrar como o coletor pode transformar dados em tempo real, seja inserindo novos campos, removendo informações desnecessárias ou mascarando dados sensíveis para evitar exposições indesejadas.
Abaixo, explicamos os principais blocos da configuração:
- receivers: definem os endpoints de entrada por onde o coletor recebe os dados. É aqui que especificamos quais protocolos ou fontes o OpenTelemetry Collector deve escutar.
- processors : responsáveis por transformar os dados recebidos. Podemos, por exemplo, remover informações sensíveis, adicionar marcações personalizadas (como tags de ambiente ou origem), ou filtrar dados irrelevantes, garantindo que apenas informações úteis sejam enviadas para os destinos finais.
- exporters: definem os destinos para onde os dados de observabilidade serão enviados. Entre as opções mais comuns estão o Jaeger, DataDog, Prometheus, entre outros sistemas de monitoramento e rastreamento.
- service: é aqui que configuramos as pipelines de execução para cada um dos pilares da observabilidade — logs, traces e métricas. Cada pipeline determina quais são os seus respectivos receivers, processors e exporters, orquestrando o fluxo completo dos dados dentro do coletor.
Os containers
- docker-compose.yml
name: otel

services:
  otel:
    profiles: [all, otel]
    networks:
      - otel
    ports:
      - 14317:4317
      - 14318:4318
      - 18888:18888
    image: otel/opentelemetry-collector-contrib:0.123.0
    command: ["--config=/conf/otel-collector-config.yaml"]
    privileged: true
    volumes:
      - "./otel/otel-collector-config.yaml:/conf/otel-collector-config.yaml"
    depends_on:
      - loki

  jaeger:
    profiles: [all, otel]
    networks:
      - otel
    image: jaegertracing/all-in-one:1.68.0
    ports:
      - 16687:16686
    depends_on:
      - otel

  prometheus:
    profiles: [all, otel]
    networks:
      - otel
    image: prom/prometheus:v3.2.1
    ports:
      - "9090:9090"
    volumes:
      - prometheus-data:/prometheus
      - ./prometheus/prometheus.yml:/etc/prometheus/prometheus.yml

  grafana:
    profiles: [all, grafana]
    networks:
      - otel
    image: grafana/grafana:11.6.0
    ports:
      - "3000:3000"
    environment:
      - GF_SECURITY_ADMIN_PASSWORD=admin
    volumes:
      - grafana-data:/var/lib/grafana
    depends_on:
      - loki
      - tempo

  loki:
    profiles: [all, grafana]
    networks:
      - otel
    image: grafana/loki:3
    command: [ "-config.file=/etc/loki/local-config.yaml" ]
    ports:
      - "3100:3100"
    volumes:
      - ./grafana/loki-config.yaml:/etc/loki/local-config.yaml
      - loki-rules-data:/etc/loki/rules/fake

  promtail:
    profiles: [all, grafana]
    networks:
      - otel
    image: grafana/promtail:3
    volumes:
      - ./grafana/promtail-config.yaml:/etc/promtail/config.yml
      - /var/log:/var/log
      - /var/lib/docker/containers:/var/lib/docker/containers
    depends_on:
      - loki
      - prometheus

  tempo:
    profiles: [all, grafana]
    networks:
      - otel
    image: grafana/tempo:latest
    command: [ "-config.file=/etc/tempo/tempo.yaml" ]
    ports:
      - "3200:3200"
    volumes:
      - ./grafana/tempo-config.yaml:/etc/tempo/tempo.yaml
      - tempo-data:/var/tempo

  redis:
    profiles: [all, db]
    networks:
      - otel
    image: bitnami/redis:7.2
    environment:
      - ALLOW_EMPTY_PASSWORD=yes
    ports:
      - 6379:6379

  python:
    profiles: [all, apps]
    networks:
      - otel
    build:
      dockerfile: ./app/python/Containerfile
    environment:
      - PORT=8000
      - OTEL_PYTHON_LOGGING_AUTO_INSTRUMENTATION_ENABLED=true
      - OTEL_EXPORTER_OTLP_ENDPOINT=http://otel:4317
      - OTEL_EXPORTER_OTLP_TRACES_ENDPOINT=http://otel:4317/v1/traces
      - OTEL_EXPORTER_OTLP_METRICS_ENDPOINT=http://otel:4317/v1/metrics
      - OTEL_RESOURCE_ATTRIBUTES="service.name=python-otlp,team=dev,cluster-name=local,env=dev"
      - OTEL_SERVICE_NAME=python-otlp
    ports:
      - 8000:8000
    depends_on:
      - otel

  go:
    profiles: [all, apps]
    networks:
      - otel
    build:
      dockerfile: ./app/go/Containerfile
    environment:
      - OTEL_EXPORTER_OTLP_ENDPOINT=http://otel:4317
      - OTEL_RESOURCE_ATTRIBUTES="service.name=go-otlp,team=dev,cluster-name=local,env=dev"
      - OTEL_SERVICE_NAME=go-otlp
      - REDIS_URL=redis:6379
    ports:
      - 8001:8001
    depends_on:
      - otel

  ruby:
    profiles: [all, apps]
    networks:
      - otel
    build:
      dockerfile: ./app/ruby/Containerfile
    environment:
      - PORT=8002
      - OTEL_EXPORTER_OTLP_TRACES_ENDPOINT=http://otel:4318/v1/traces
      - OTEL_EXPORTER_OTLP_METRICS_ENDPOINT=http://otel:4318/v1/metrics
      - OTEL_RESOURCE_ATTRIBUTES="service.name=ruby-otlp,team=dev,cluster-name=local,env=dev"
      - OTEL_SERVICE_NAME=ruby-otlp
      - OTEL_TRACES_EXPORTER=otlp
    ports:
      - 8002:8002
    depends_on:
      - otel

  node:
    profiles: [all, apps]
    networks:
      - otel
    build:
      dockerfile: ./app/node/Containerfile
    environment:
      - PORT=8003
      - OTEL_EXPORTER_OTLP_ENDPOINT=http://otel:4318
      - OTEL_EXPORTER_OTLP_TRACES_ENDPOINT=http://otel:4318/v1/traces
      - OTEL_EXPORTER_OTLP_METRICS_ENDPOINT=http://otel:4318/v1/metrics
      - OTEL_RESOURCE_ATTRIBUTES="service.name=node-otlp,team=dev,cluster-name=local,env=dev"
      - OTEL_SERVICE_NAME=node-otlp
      - OTEL_TRACES_EXPORTER=otlp
    ports:
      - 8003:8003
    depends_on:
      - otel

volumes:
  tempo-data:
  loki-rules-data:
  grafana-data:
  prometheus-data:

networks:
  otel:
    name: "otel"
- Otel: Abreviação de OpenTelemetry Collector, é o componente responsável por receber, processar e exportar dados de observabilidade como logs, métricas e traces.
- Jaeger: Ferramenta de distributed tracing que permite rastrear o caminho completo de uma requisição em sistemas distribuídos, sendo muito útil em arquiteturas de microserviços para identificar gargalos e monitorar a performance entre serviços.
- Prometheus: Solução de monitoramento que coleta e armazena métricas em tempo real. Possui suporte a consultas avançadas e permite a criação de alertas e dashboards personalizados.
- Grafana: Plataforma web de código aberto para visualização e análise de dados. Suporta múltiplas fontes, como Prometheus, Loki e Tempo, e é amplamente utilizada para criação de dashboards interativos.
- Loki: Sistema de gerenciamento de logs desenvolvido pela Grafana Labs. Ao contrário de outras soluções, como o Elasticsearch, o Loki é otimizado para trabalhar em conjunto com Prometheus e Grafana, utilizando os mesmos rótulos (labels) e focando em logs estruturados e de fácil correlação com métricas e traces.
- Promtail: Agente responsável por coletar logs de arquivos locais e enviá-los ao Loki, o sistema de gerenciamento de logs da Grafana.
- Tempo: Plataforma open-source mantida pela Grafana Labs, voltada para o gerenciamento de distributed tracing. Permite a correlação de traces com métricas e logs em um único ambiente visual.
- Redis: Sistema de cache em memória amplamente utilizado por aplicações. Pensando em testes do contexto de observabilidade, pode gerar spans de traces relacionados a operações de leitura e escrita no cache.
- Python, Ruby, Go e Node: Exemplos de containers de aplicação que atuam como fontes de dados para o coletor OpenTelemetry, fornecendo logs, métricas e traces que alimentam todo o pipeline de observabilidade.
Os arquivos de configuração do Loki, Tempo e Promtail estão disponíveis no repositório e devem ser baixados antes da execução. Eles garantem que cada serviço funcione corretamente dentro do pipeline de observabilidade.
Instrumentação
No repositório, você encontrará diversos exemplos de instrumentação. Neste artigo, vamos focar brevemente na implementação em Go. Por ser uma linguagem compilada, o Go exige uma abordagem mais explícita e detalhada na instrumentação. Já em linguagens interpretadas como Node.js, Ruby e Python, esse processo tende a ser mais simples, graças aos recursos de metaprogramação que facilitam a inserção automática de telemetria no código.
Go
package main

import (
	"context"
	"encoding/json"
	"fmt"
	"log"
	"os"

	"net/http"

	"github.com/brianvoe/gofakeit/v7"
	"github.com/prometheus/client_golang/prometheus"
	"github.com/prometheus/client_golang/prometheus/promauto"
	"github.com/prometheus/client_golang/prometheus/promhttp"
	"github.com/redis/go-redis/extra/redisotel/v9"
	"github.com/redis/go-redis/v9"
	"go.opentelemetry.io/contrib/instrumentation/net/http/otelhttp"
	"go.opentelemetry.io/otel"
	"go.opentelemetry.io/otel/attribute"
	"go.opentelemetry.io/otel/exporters/otlp/otlptrace"
	"go.opentelemetry.io/otel/exporters/otlp/otlptrace/otlptracegrpc"
	"go.opentelemetry.io/otel/sdk/resource"
	sdktrace "go.opentelemetry.io/otel/sdk/trace"
	"go.opentelemetry.io/otel/trace"
)

// Email counter metric
var emailCounter = promauto.NewCounter(prometheus.CounterOpts{
	Name: "email_counter",
	Help: "The total number of email sent",
})

// Shutdown handler is responsible for finishing trace.
type ShutdownHandler func(context.Context) error

// Regular email data
type Email struct {
	From    string `json:"from"`
	To      string `json:"to"`
	Subject string `json:"subject"`
	Body    string `json:"body"`
}

// Regular customer
type Customer struct {
	Id       string // the customer unique id
	Name     string // the customer name
	Document string // the document number
	Email    string // the customer email
}

// This function is responsible for setting up the program before it runs
func init() {
	gofakeit.Seed(0)
}

// Build redis client connection
func setupRedis() *redis.Client {
	rdb := redis.NewClient(&redis.Options{
		Addr:     os.Getenv("REDIS_URL"),
		Password: "",
		DB:       0,
	})

	if err := redisotel.InstrumentTracing(rdb); err != nil {
		panic(err)
	}

	if err := redisotel.InstrumentMetrics(rdb); err != nil {
		panic(err)
	}

	return rdb
}

// Initializes the open telemetry tracer.
func setupTracer(ctx context.Context) (ShutdownHandler, error) {
	exporter, err := otlptracegrpc.New(ctx)
	if err != nil {
		return nil, err
	}

	tp := buildTracer(ctx, exporter)

	otel.SetTracerProvider(tp)

	return tp.Shutdown, nil
}

// Build an open telemetry tracer
func buildTracer(ctx context.Context, exporter *otlptrace.Exporter) *sdktrace.TracerProvider {
	res, err := resource.New(ctx,
		resource.WithAttributes(
			attribute.String("service.name", os.Getenv("OTEL_SERVICE_NAME")),
		),
	)

	if err != nil {
		panic(err)
	}

	return sdktrace.NewTracerProvider(
		sdktrace.WithBatcher(exporter),
		sdktrace.WithResource(res),
	)
}

// Responsible for finalizing trace context.
func doShutdown(ctx context.Context, shutdown ShutdownHandler) {
	func() {
		if err := shutdown(ctx); err != nil {
			log.Fatalf("failed to shut down tracer: %v", err)
		}
	}()

}

// Add span attributes values
func setupSpanValues(span trace.Span) {
	span.SetAttributes(
		attribute.String("customer.id", gofakeit.UUID()),
		attribute.String("customer.email", gofakeit.Email()),
		attribute.String("customer.password", gofakeit.Password(true, true, true, true, true, 10)),
		attribute.String("customer.vatnumber", gofakeit.SSN()),
		attribute.String("customer.credit_card", gofakeit.CreditCard().Number),
		attribute.String("db.user", gofakeit.Username()),
		attribute.String("db.password", gofakeit.Password(true, true, true, true, true, 10)),
		attribute.String("account.email", gofakeit.Email()),
	)
}

// Returns an internal server error
func writeHttpError(span trace.Span, w http.ResponseWriter, errorMessage string) {
	span.AddEvent("error",
		trace.WithAttributes(
			attribute.String("value", errorMessage),
		),
	)
	span.End()

	w.WriteHeader(http.StatusInternalServerError)
	w.Write([]byte(errorMessage))
}

// Route to generate stats for every request.
func sendEmailRoute(rdb *redis.Client) func(w http.ResponseWriter, r *http.Request) {
	return func(w http.ResponseWriter, r *http.Request) {
		tracer := otel.Tracer("go-tracer")
		_, span := tracer.Start(r.Context(), "send-email")

		message, err := gofakeit.EmailText(&gofakeit.EmailOptions{})

		if err != nil {
			writeHttpError(span, w, fmt.Sprintf("failed to fetch random message: %v", err))
			return
		}

		customer := Customer{
			Id:       gofakeit.UUID(),
			Name:     gofakeit.Name(),
			Email:    gofakeit.Email(),
			Document: gofakeit.SSN(),
		}

		email := Email{
			From:    fmt.Sprintf("no-reply@%v", gofakeit.DomainName()),
			To:      customer.Email,
			Subject: gofakeit.BookTitle(),
			Body:    message,
		}

		span.SetAttributes(
			attribute.String("customer.id", customer.Id),
			attribute.String("customer.email", customer.Email),
			attribute.String("customer.document", customer.Document),
		)

		setupSpanValues(span)

		jsonEmail, err := json.Marshal(email)

		if err != nil {
			writeHttpError(span, w, fmt.Sprintf("failed to parse email message: %v", err))
			return
		}

		err = rdb.SPublish(r.Context(), "email", jsonEmail).Err()

		if err != nil {
			writeHttpError(span, w, fmt.Sprintf("failed to queue email message: %v", err))
			return
		}

		span.AddEvent("email",
			trace.WithAttributes(
				attribute.String("subject", email.Subject),
				attribute.String("content", email.Body),
			),
		)

		emailCounter.Inc()

		response := fmt.Sprintf("📨 The email was queued successfully: %v", email.Subject)

		span.AddEvent("log-message", trace.WithAttributes(attribute.String("message", message)))

		log.Println(message)

		span.End()

		w.WriteHeader(http.StatusCreated)
		w.Write([]byte(response))
	}
}

func main() {
	rdb := setupRedis()
	ctx := context.Background()
	shutdown, err := setupTracer(ctx)

	if err != nil {
		log.Fatalf("failed to initialize open telemetry tracer: %v", err)
	}

	defer doShutdown(ctx, shutdown)

	otelHandler := otelhttp.NewHandler(http.HandlerFunc(sendEmailRoute(rdb)), "SendEmail")

	http.Handle("/metrics", promhttp.Handler())
	http.Handle("/send-email", otelHandler)

	http.ListenAndServe(":8001", nil)
}
Abaixo temos a implementação de uma métrica do tipo contador, responsável por registrar o total de e-mails enviados. Esse tipo de dado pode ser utilizado para gerar gráficos, indicar o funcionamento da aplicação e até mesmo disparar alertas em situações anômalas.
No caso específico da aplicação escrita em Go, optei por utilizar o Prometheus para expor as métricas em vez do próprio OpenTelemetry. Isso porque, durante os testes, apenas a aplicação em Go apresentou dificuldades ao despachar métricas diretamente via OTel.
Felizmente, o Prometheus é totalmente compatível com o OpenTelemetry Collector, o que nos permite integrá-lo de forma transparente ao pipeline de observabilidade.
var emailCounter = promauto.NewCounter(prometheus.CounterOpts{
Name: "email_counter",
Help: "The total number of email sent",
})
http.Handle("/metrics", promhttp.Handler())
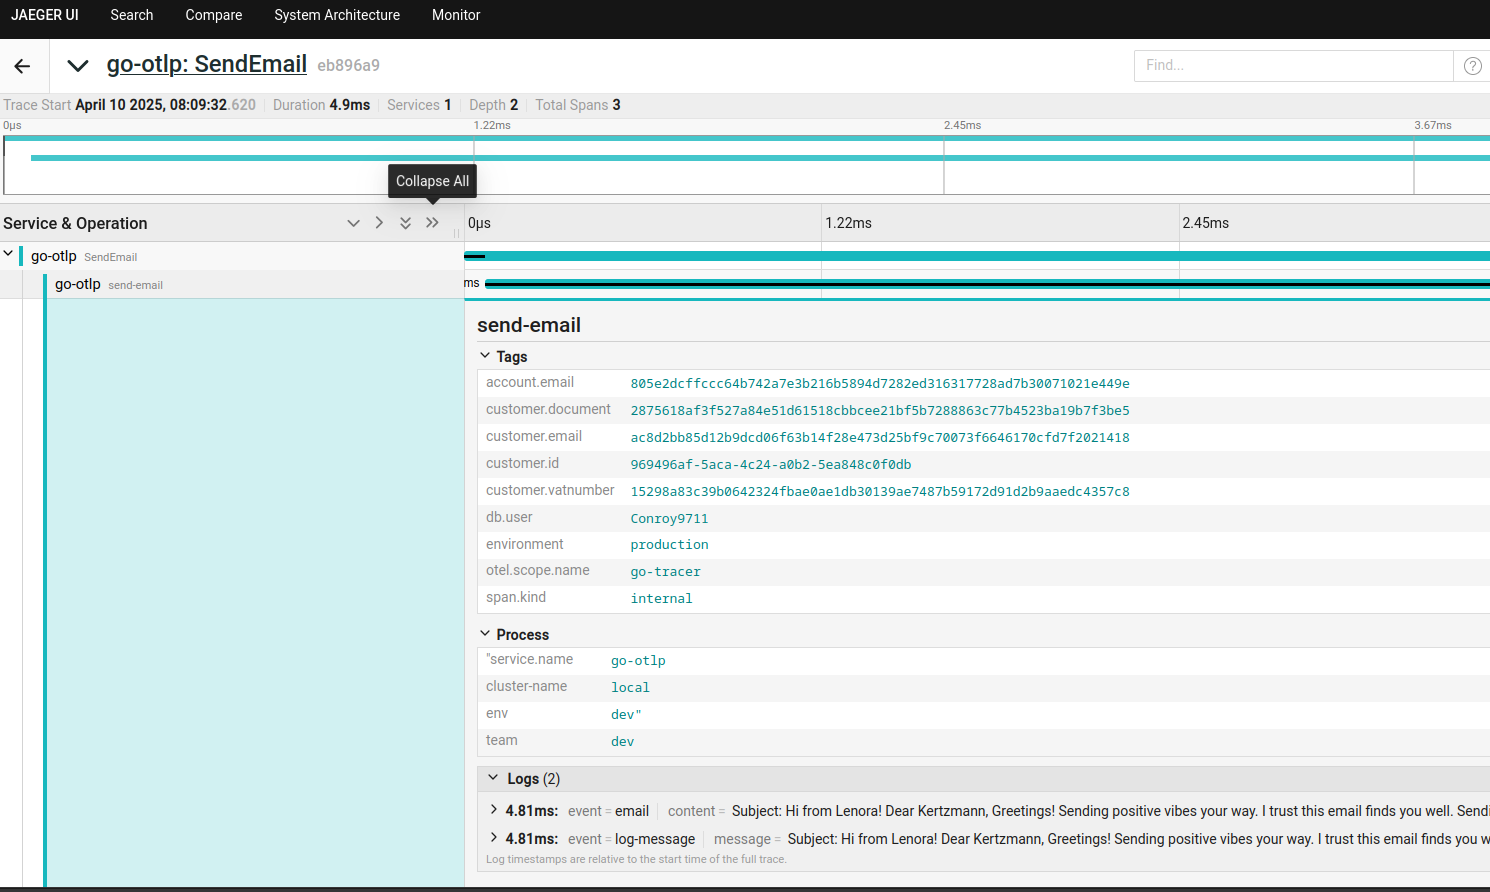
http.ListenAndServe(":8001", nil)Aqui estamos enviando por meio do tracer um span (send-email), que representa uma ação ou operação dentro do sistema. Esse rastro pode ser visualizado nas ferramentas de observabilidade para ajudar a entender o comportamento da aplicação em tempo real.
tracer := otel.Tracer("go-tracer")
_, span := tracer.Start(r.Context(), "send-email")
A integração de logs no Go funciona principalmente através de Events adicionados aos spans. No entanto, a integração direta com loggers ainda precisa ser melhor explorada.
Como o ⚠️ SDK do OpenTelemetry para Go ainda está em desenvolvimento ativo, algumas dessas funcionalidades não estão totalmente integradas ou exigem soluções manuais.
span.AddEvent("email",
    trace.WithAttributes(
        attribute.String("subject", email.Subject),
        attribute.String("content", email.Body),
    ),
)

span.AddEvent("error",
    trace.WithAttributes(
        attribute.String("value", errorMessage),
    ),
)

span.End()
Outras instrumentações, como mencionamos anteriormente, são mais simples de configurar. Você pode conferir os detalhes e exemplos completos diretamente no repositório no GitHub.
Como testar?
Preparei um script em Bash (scripts/do-requests.sh) que será responsável por executar múltiplas requisições nas aplicações, com o objetivo de gerar logs, métricas e traces que alimentarão nosso pipeline de observabilidade.
Antes de executar o script, é importante garantir que todos os containers estejam em funcionamento. Para isso, utilize o seguinte comando:
docker compose --profile all up -dEsse comando irá iniciar todos os serviços definidos no docker-compose.yml em segundo plano. Assim que os containers estiverem ativos, podemos prosseguir com a execução do script de carga para simular o comportamento das aplicações.
Com todos os containers em execução, estamos prontos para gerar os insumos de observabilidade — ou seja, os logs, métricas e traces que serão processados pelo nosso coletor.
Execute o comando abaixo para iniciar o script de carga:
bash scripts/do-requests.sh
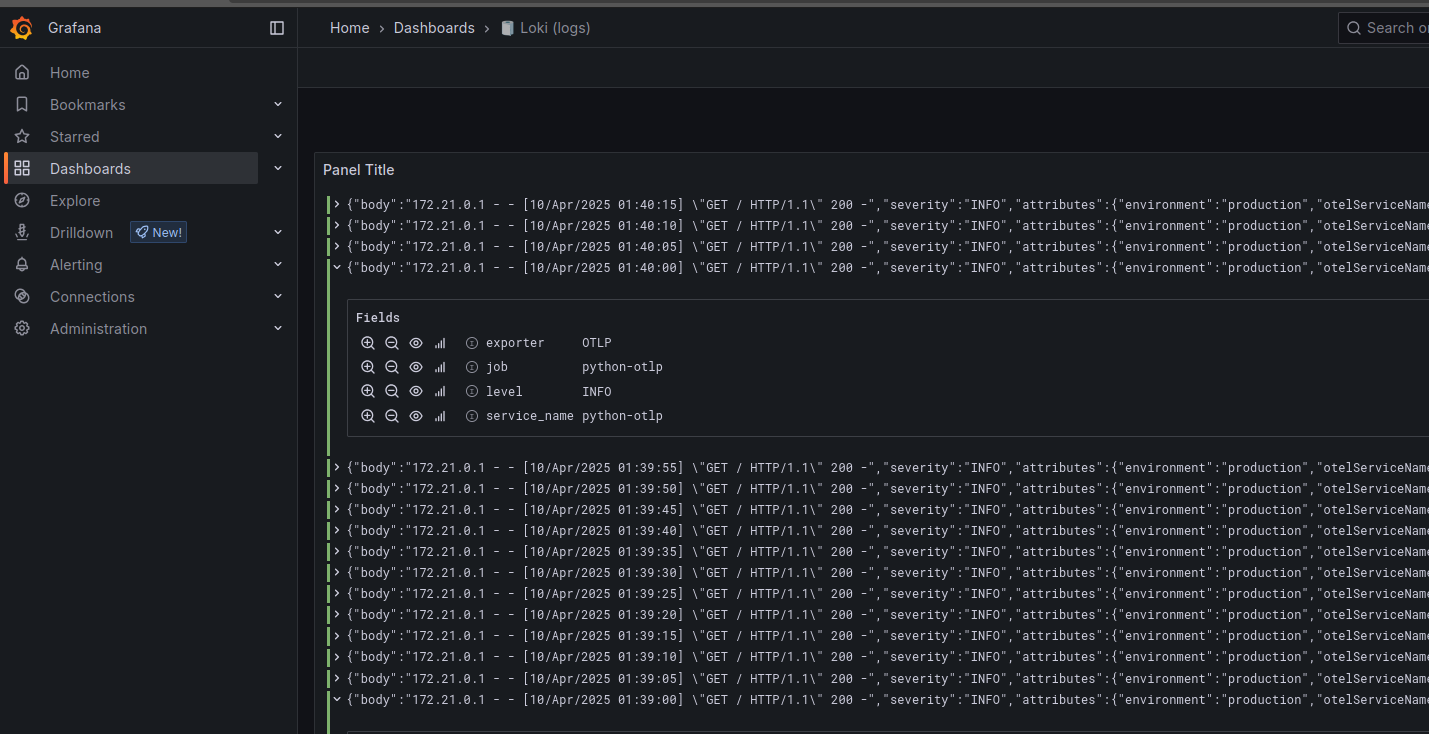
Após a execução, já teremos dados disponíveis para visualização direta no Grafana e no Jaeger, que foram definidos como nossos exporters.
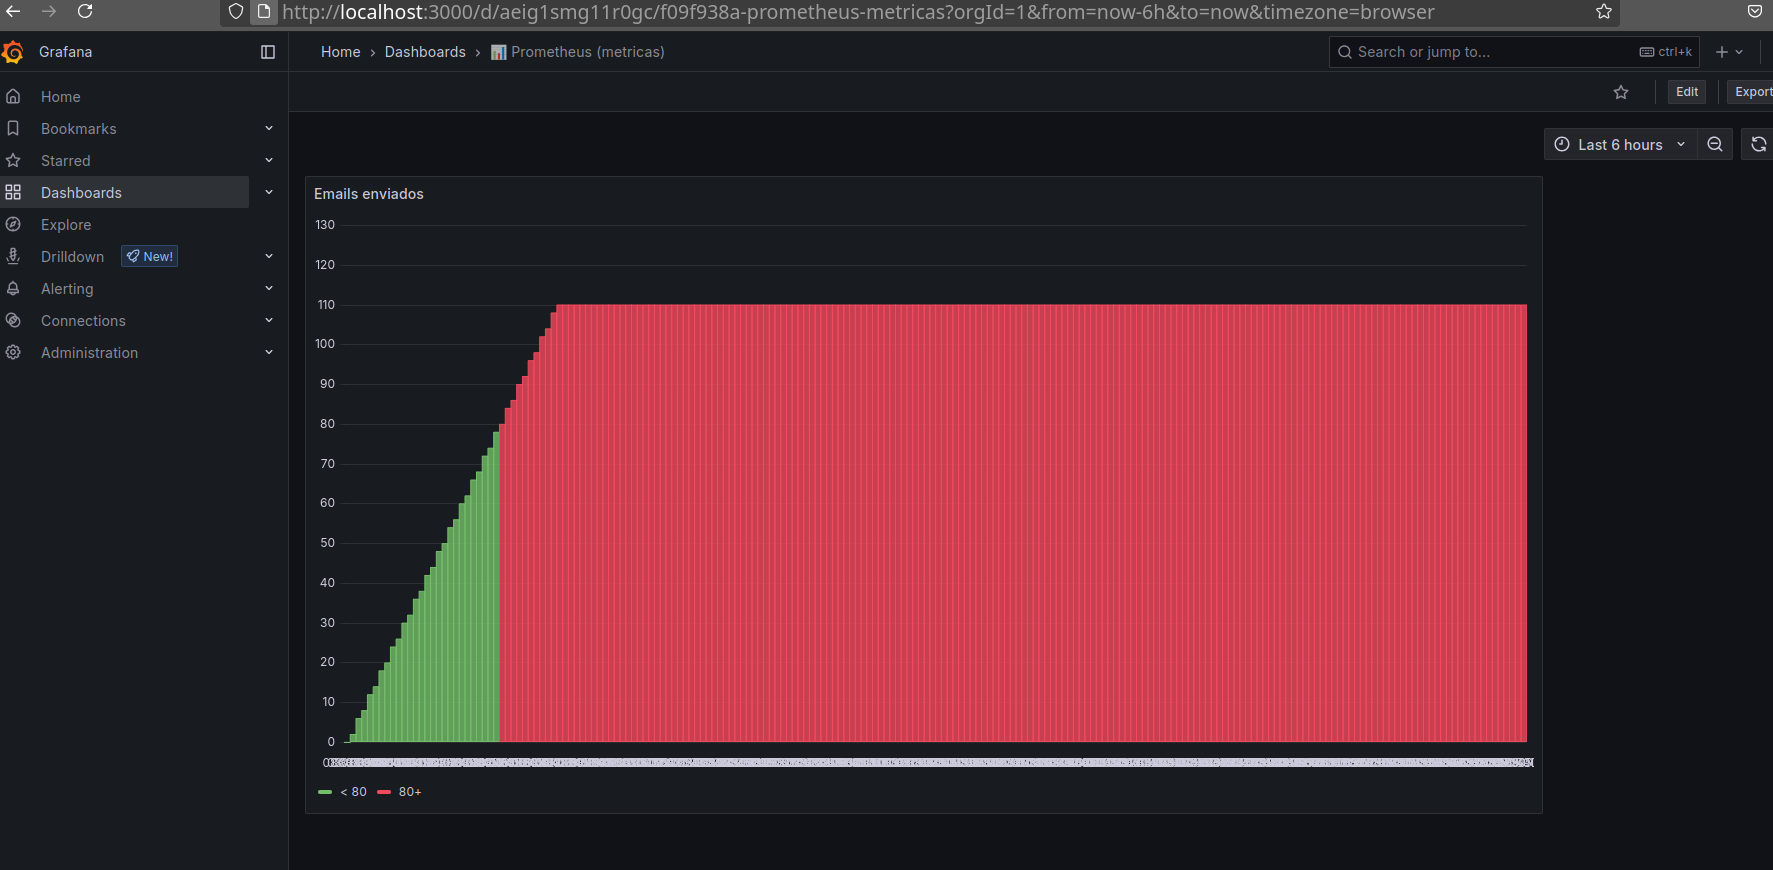
Grafana
O Grafana tem como foco oferecer uma experiência completa em observabilidade. Além de visualizar logs, traces e métricas, ele permite criar dashboards personalizadas e configurar alertas inteligentes, proporcionando uma visão centralizada e em tempo real do comportamento dos sistemas.
No detalhe 🔍
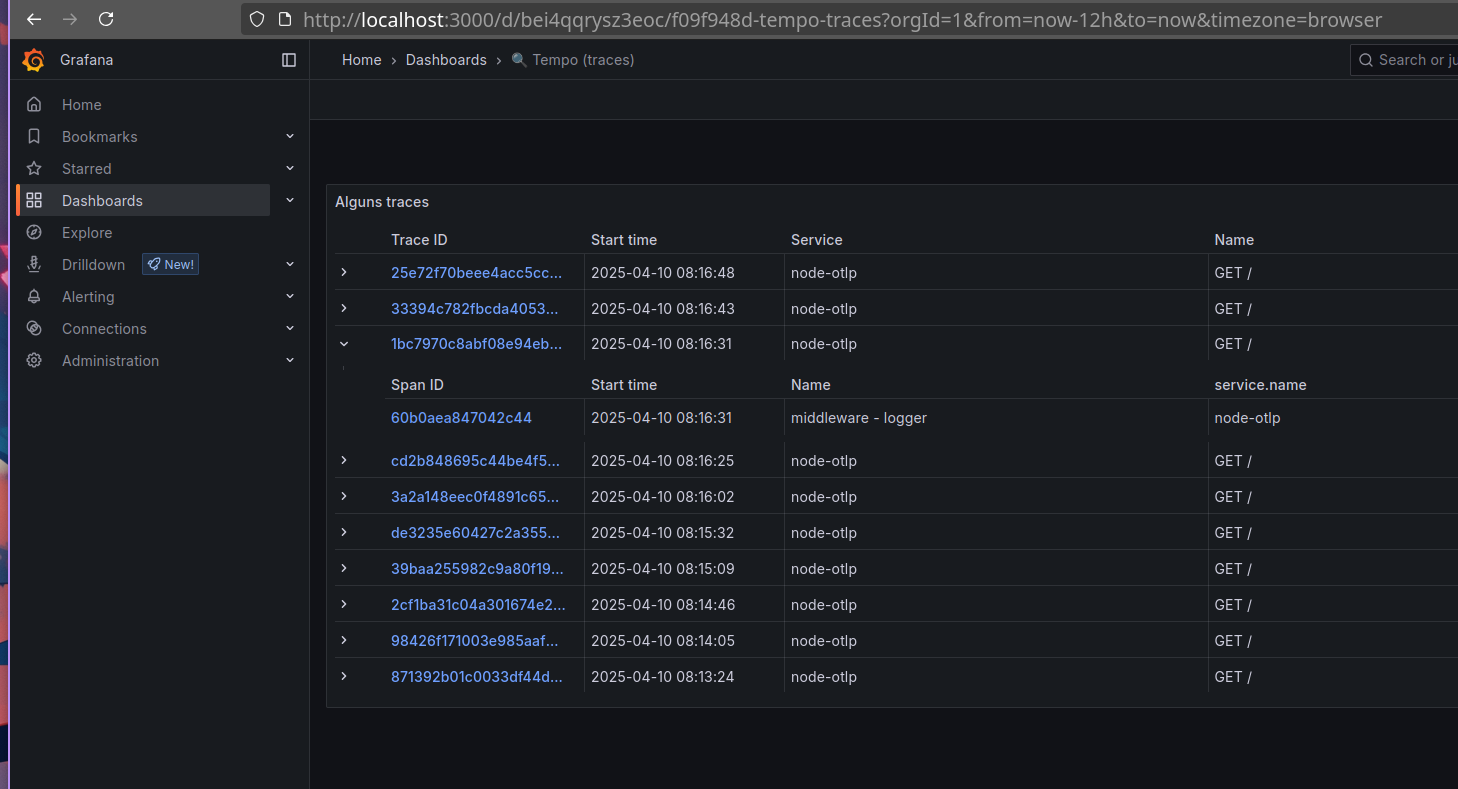
Jaeger
Com o Jaeger, é possível observar traces, métricas e logs de forma minimalista e objetiva. Ele é extremamente útil para identificar gargalos e entender o fluxo de requisições dentro da aplicação, especialmente em ambientes com microsserviços. Além disso, o Jaeger permite importar traces em formato JSON, facilitando análises manuais ou integrações com outras ferramentas.
No detalhe 🔍
Conclusão
Neste artigo, criamos um exemplo prático de integração de aplicações em diferentes linguagens com o OpenTelemetry. Exploramos as principais configurações do repositório e vimos como os dados de observabilidade são exibidos no Jaeger e no Grafana.
Espero que essa introdução ao OpenTelemetry ajude a aumentar a visibilidade dos seus projetos e torne sua vida de desenvolvedor mais tranquila — e com menos emoções indesejadas.

E por hoje é isso!
Que Deus 🕊️ te abençoe, e não se esqueça: mantenha seu kernel 🧠 sempre atualizado!
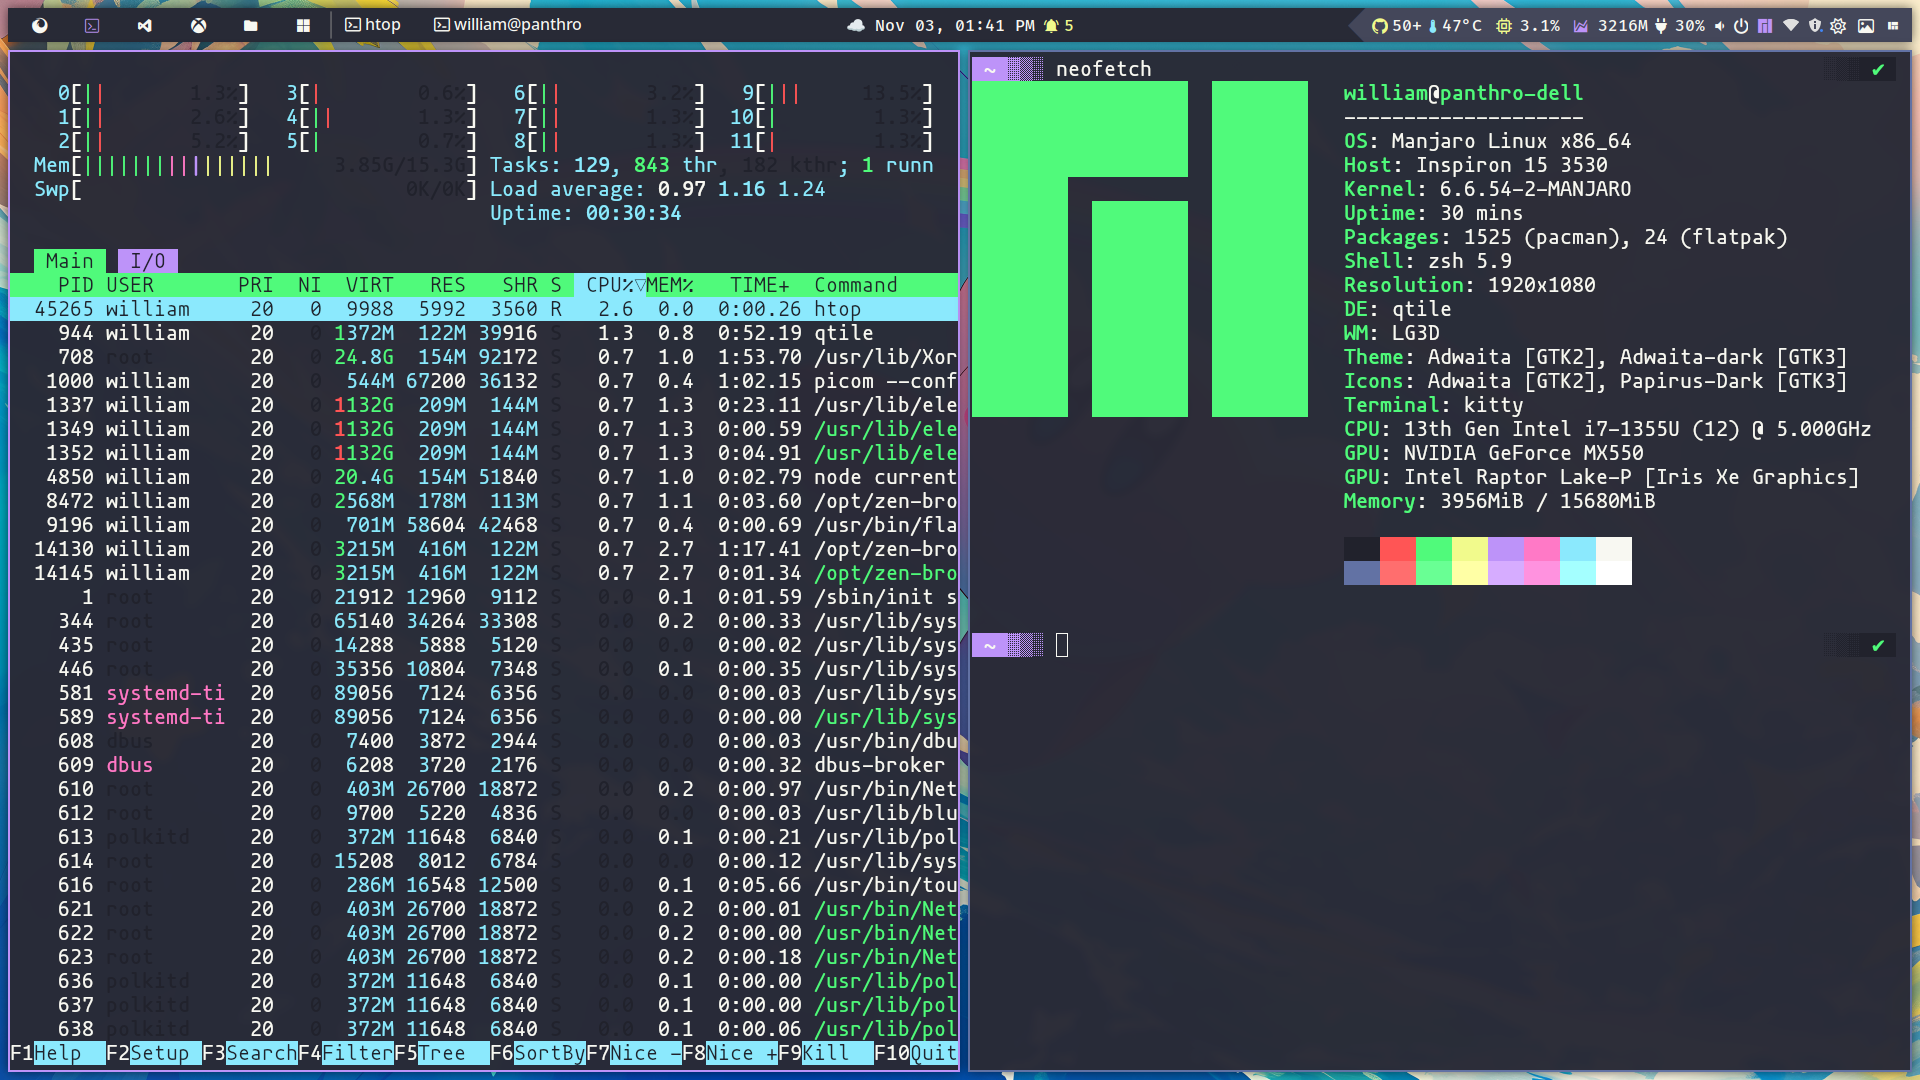
]]>A few months ago, I got back with a new experience, this time Qtile. A friend told me about this Window Manager because I was doing some things in Python at the time, but I decided to test other things in my mind, so I was using AwesomeWM, another wonder tiling Manager, in which I spent a lot of time customizing things and making dotfiles more usable and available at my github repository. This time, I did the same thing, but got deeper than Awesome WM, bringing desktop tastes inside Window Manager.
Desktop tastes 😋?
It may seem a bit unusual, but I truly appreciate the dual aspects of simplicity in configuring your graphical environment and the capability to enhance and personalize the experience, making it all unique and highly productive.

This piece is not about why I chose Qtile over Awesome WM, Hyprland, I3, and other available solutions, but I will give my reasons for doing so right now:
- I'm afraid and thinking about Wayland, because some distros were adopting Wayland instead of X11, so I thought, humm..., maybe in the next years I could have some problems, and I looked at Hyprland, but I didn't have a perfect experience with Wayland at the time, so I decided to be in the middle because Qtile works with both X11 and Wayland, despite the fact that I'm still using X11 😆.
- Lua looks very simple, and I enjoy it, but so is Python, and there is a large list of packages that we can use with 🐧Linux compatibility.
- Another challenge is that setting up Qtile is much easier than setting up Awesome WM, but I don't have all of the powers that I had in Awesome WM; for example, dropdown menus perform well in Awesome WM, but with Qtile I decided to utilize Rofi scripts because things didn't work properly.
That's my viewpoint. I still have Awesome WM, Qtile, and other Window Managers installed and working on my personal laptop because I enjoy them, and when you use Window Manager and customize things, you should be prepared for some crashes; even though I have versioned my dotfile in the github repository, incompatibilities can occur at any time.
Awesome WM lover ❤️?
After reading my piece, you should check out this article that shares my experience with dotfiles. 😁

First of all, what is Qtile?
Qtile is a dynamic tiling window manager for X11 and Wayland that was written in Python. It's very customisable, with users able to set layouts, keybindings, and widgets via a simple Python configuration file. Designed for power users, Qtile offers a mix between automation and flexibility, making it an excellent solution for those desiring a personalized and efficient workflow.
What is Qtile Ebenezer?
I started customizing Qtile using just dotfiles, but then I thought: Why shouldn't others be able to reuse the widgets I built? Just like I did in AwesomeWM with Lain and Awesome Buttons, I wanted to create something reusable.
So, I built a PyPI library and an AUR package. Why both?
- PyPI: Serves as a library for testing and checking Qtile configurations.
- AUR: Installing system-wide Python packages via pip can break your system, which is why an AUR package is necessary. You’ve probably seen the warning when trying to install Python packages globally with
pip.
Ebenezer 🪨
This library was named Ebenezer 🪨, which meaning "stone of helper.".
The quote is from I Samuel 7. After defeating the Philistines, Samuel raises his Ebenezer, declaring that God defeated the enemies on this spot. As a result, "hither by thy help I come." So I hope this stone helps you in your environment and, more importantly, in your life. 🙏🏿
The config.py file is where magic ✨ happens...
This is the entry point where we configure all window behaviours such as shortcuts, how many desktops we want, whether we want a top, bottom, or left bar, the startup process, and predefined configurations for specific windows or desktops, so as with any window manager, you can customize your environment to be as you want and, most importantly, productive.
Following we have a default Qtile configuration file:
# Copyright (c) 2010 Aldo Cortesi
# Copyright (c) 2010, 2014 dequis
# Copyright (c) 2012 Randall Ma
# Copyright (c) 2012-2014 Tycho Andersen
# Copyright (c) 2012 Craig Barnes
# Copyright (c) 2013 horsik
# Copyright (c) 2013 Tao Sauvage
#
# Permission is hereby granted, free of charge, to any person obtaining a copy
# of this software and associated documentation files (the "Software"), to deal
# in the Software without restriction, including without limitation the rights
# to use, copy, modify, merge, publish, distribute, sublicense, and/or sell
# copies of the Software, and to permit persons to whom the Software is
# furnished to do so, subject to the following conditions:
#
# The above copyright notice and this permission notice shall be included in
# all copies or substantial portions of the Software.
#
# THE SOFTWARE IS PROVIDED "AS IS", WITHOUT WARRANTY OF ANY KIND, EXPRESS OR
# IMPLIED, INCLUDING BUT NOT LIMITED TO THE WARRANTIES OF MERCHANTABILITY,
# FITNESS FOR A PARTICULAR PURPOSE AND NONINFRINGEMENT. IN NO EVENT SHALL THE
# AUTHORS OR COPYRIGHT HOLDERS BE LIABLE FOR ANY CLAIM, DAMAGES OR OTHER
# LIABILITY, WHETHER IN AN ACTION OF CONTRACT, TORT OR OTHERWISE, ARISING FROM,
# OUT OF OR IN CONNECTION WITH THE SOFTWARE OR THE USE OR OTHER DEALINGS IN THE
# SOFTWARE.

from libqtile import bar, layout, qtile, widget
from libqtile.config import Click, Drag, Group, Key, Match, Screen
from libqtile.lazy import lazy
from libqtile.utils import guess_terminal

mod = "mod4"
terminal = guess_terminal()

keys = [
    # A list of available commands that can be bound to keys can be found
    # at https://docs.qtile.org/en/latest/manual/config/lazy.html
    # Switch between windows
    Key([mod], "h", lazy.layout.left(), desc="Move focus to left"),
    Key([mod], "l", lazy.layout.right(), desc="Move focus to right"),
    Key([mod], "j", lazy.layout.down(), desc="Move focus down"),
    Key([mod], "k", lazy.layout.up(), desc="Move focus up"),
    Key([mod], "space", lazy.layout.next(), desc="Move window focus to other window"),
    # Move windows between left/right columns or move up/down in current stack.
    # Moving out of range in Columns layout will create new column.
    Key(
        [mod, "shift"], "h", lazy.layout.shuffle_left(), desc="Move window to the left"
    ),
    Key(
        [mod, "shift"],
        "l",
        lazy.layout.shuffle_right(),
        desc="Move window to the right",
    ),
    Key([mod, "shift"], "j", lazy.layout.shuffle_down(), desc="Move window down"),
    Key([mod, "shift"], "k", lazy.layout.shuffle_up(), desc="Move window up"),
    # Grow windows. If current window is on the edge of screen and direction
    # will be to screen edge - window would shrink.
    Key([mod, "control"], "h", lazy.layout.grow_left(), desc="Grow window to the left"),
    Key(
        [mod, "control"], "l", lazy.layout.grow_right(), desc="Grow window to the right"
    ),
    Key([mod, "control"], "j", lazy.layout.grow_down(), desc="Grow window down"),
    Key([mod, "control"], "k", lazy.layout.grow_up(), desc="Grow window up"),
    Key([mod], "n", lazy.layout.normalize(), desc="Reset all window sizes"),
    # Toggle between split and unsplit sides of stack.
    # Split = all windows displayed
    # Unsplit = 1 window displayed, like Max layout, but still with
    # multiple stack panes
    Key(
        [mod, "shift"],
        "Return",
        lazy.layout.toggle_split(),
        desc="Toggle between split and unsplit sides of stack",
    ),
    Key([mod], "Return", lazy.spawn(terminal), desc="Launch terminal"),
    # Toggle between different layouts as defined below
    Key([mod], "Tab", lazy.next_layout(), desc="Toggle between layouts"),
    Key([mod], "w", lazy.window.kill(), desc="Kill focused window"),
    Key(
        [mod],
        "f",
        lazy.window.toggle_fullscreen(),
        desc="Toggle fullscreen on the focused window",
    ),
    Key(
        [mod],
        "t",
        lazy.window.toggle_floating(),
        desc="Toggle floating on the focused window",
    ),
    Key([mod, "control"], "r", lazy.reload_config(), desc="Reload the config"),
    Key([mod, "control"], "q", lazy.shutdown(), desc="Shutdown Qtile"),
    Key([mod], "r", lazy.spawncmd(), desc="Spawn a command using a prompt widget"),
]

# Add key bindings to switch VTs in Wayland.
# We can't check qtile.core.name in default config as it is loaded before qtile is started
# We therefore defer the check until the key binding is run by using .when(func=...)
for vt in range(1, 8):
    keys.append(
        Key(
            ["control", "mod1"],
            f"f{vt}",
            lazy.core.change_vt(vt).when(func=lambda: qtile.core.name == "wayland"),
            desc=f"Switch to VT{vt}",
        )
    )


groups = [Group(i) for i in "123456789"]

for i in groups:
    keys.extend(
        [
            # mod + group number = switch to group
            Key(
                [mod],
                i.name,
                lazy.group[i.name].toscreen(),
                desc="Switch to group {}".format(i.name),
            ),
            # mod + shift + group number = switch to & move focused window to group
            Key(
                [mod, "shift"],
                i.name,
                lazy.window.togroup(i.name, switch_group=True),
                desc="Switch to & move focused window to group {}".format(i.name),
            ),
            # Or, use below if you prefer not to switch to that group.
            # # mod + shift + group number = move focused window to group
            # Key([mod, "shift"], i.name, lazy.window.togroup(i.name),
            #     desc="move focused window to group {}".format(i.name)),
        ]
    )

layouts = [
    layout.Columns(border_focus_stack=["#d75f5f", "#8f3d3d"], border_width=4),
    layout.Max(),
    # Try more layouts by unleashing below layouts.
    # layout.Stack(num_stacks=2),
    # layout.Bsp(),
    # layout.Matrix(),
    # layout.MonadTall(),
    # layout.MonadWide(),
    # layout.RatioTile(),
    # layout.Tile(),
    # layout.TreeTab(),
    # layout.VerticalTile(),
    # layout.Zoomy(),
]

widget_defaults = dict(
    font="sans",
    fontsize=12,
    padding=3,
)
extension_defaults = widget_defaults.copy()

screens = [
    Screen(
        bottom=bar.Bar(
            [
                widget.CurrentLayout(),
                widget.GroupBox(),
                widget.Prompt(),
                widget.WindowName(),
                widget.Chord(
                    chords_colors={
                        "launch": ("#ff0000", "#ffffff"),
                    },
                    name_transform=lambda name: name.upper(),
                ),
                widget.TextBox("default config", name="default"),
                widget.TextBox("Press <M-r> to spawn", foreground="#d75f5f"),
                # NB Systray is incompatible with Wayland, consider using StatusNotifier instead
                # widget.StatusNotifier(),
                widget.Systray(),
                widget.Clock(format="%Y-%m-%d %a %I:%M %p"),
                widget.QuickExit(),
            ],
            24,
            # border_width=[2, 0, 2, 0],  # Draw top and bottom borders
            # border_color=["ff00ff", "000000", "ff00ff", "000000"]  # Borders are magenta
        ),
        # You can uncomment this variable if you see that on X11 floating resize/moving is laggy
        # By default we handle these events delayed to already improve performance, however your system might still be struggling
        # This variable is set to None (no cap) by default, but you can set it to 60 to indicate that you limit it to 60 events per second
        # x11_drag_polling_rate = 60,
    ),
]

# Drag floating layouts.
mouse = [
    Drag(
        [mod],
        "Button1",
        lazy.window.set_position_floating(),
        start=lazy.window.get_position(),
    ),
    Drag(
        [mod], "Button3", lazy.window.set_size_floating(), start=lazy.window.get_size()
    ),
    Click([mod], "Button2", lazy.window.bring_to_front()),
]

dgroups_key_binder = None
dgroups_app_rules = []  # type: list
follow_mouse_focus = True
bring_front_click = False
floats_kept_above = True
cursor_warp = False
floating_layout = layout.Floating(
    float_rules=[
        # Run the utility of `xprop` to see the wm class and name of an X client.
        *layout.Floating.default_float_rules,
        Match(wm_class="confirmreset"),  # gitk
        Match(wm_class="makebranch"),  # gitk
        Match(wm_class="maketag"),  # gitk
        Match(wm_class="ssh-askpass"),  # ssh-askpass
        Match(title="branchdialog"),  # gitk
        Match(title="pinentry"),  # GPG key password entry
    ]
)
auto_fullscreen = True
focus_on_window_activation = "smart"
reconfigure_screens = True

# If things like steam games want to auto-minimize themselves when losing
# focus, should we respect this or not?
auto_minimize = True

# When using the Wayland backend, this can be used to configure input devices.
wl_input_rules = None

# xcursor theme (string or None) and size (integer) for Wayland backend
wl_xcursor_theme = None
wl_xcursor_size = 24

# XXX: Gasp! We're lying here. In fact, nobody really uses or cares about this
# string besides java UI toolkits; you can see several discussions on the
# mailing lists, GitHub issues, and other WM documentation that suggest setting
# this string if your java app doesn't work correctly. We may as well just lie
# and say that we're a working one by default.
#
# We choose LG3D to maximize irony: it is a 3D non-reparenting WM written in
# java that happens to be on java's whitelist.
wmname = "LG3D"
As I said, you can do whatever you want, but remember not to crash your desktop...

What did I change in the Qtile setup?
I looked at Python and decided to try something at AwesomeWM; why not use configuration files that can be changed instead of a Python script? So I initially built the INI in the same way that I did in Lua, but I decided to switch to yaml format because it is more versatile and easier to translate to objects, so following file describe all desktop behaviours:
Environment
You can create your preferences here, such as terminal, web browser, background settings, logo, and api settings for integrations like Weather API or GitHub
environment:
modkey: mod4
terminal: alacritty
browser: firefox
wallpaper_dir: /usr/share/backgrounds/archlinux/
wallpaper_timeout: 30
os_logo: /home/qtileuser/logos/linux.svg
theme: ebenezer
os_logo_icon:
os_logo_icon_color: "fg_white"
weather_api_key: foo
city_id: 1
github_notifications_token: foo
Groups and layouts
Here you can decide how many desktops you wish to use. Qtile organizes desktops into groups, so you can have one for terminal, browser, gaming, editor, and whatever else you want, see the documentation for more information
groups:
browsers:
terminal:
editors:
games:
files:
win:
groups_layout:
default: monadtall
win: tile
files: floating
editors: monadtall
games: max
layouts:
bsp: {}
columns: {}
floating: {}
# matrix: {}
max: {}
monadtall: {}
monadwide: {}
# radiotile: {}
tile:
ratio: 0.335
margin: 0
treetab: {}
# verticaltile: {}
# zoomy: {}
Terminal
The ALT+ENTER shortcut will open a new terminal; by default, this group uses the MonadTall layout; as you can see, this setting is available in config.yaml, and you may alter it to any layout supported by Qtile.
Startup
This section covers all you need to get started with Qtile; sometimes you should create a startup process specific to the Qtile context, for instance picom or lock screen.
startup:
  keyboard_layout: setxkbmap -model abnt2 -layout br && localectl set-x11-keymap br
  polkit: /usr/lib/polkit-gnome/polkit-gnome-authentication-agent-1 &
  picom: picom --config $home/.config/picom/picom.conf --daemon
  nm_applet: nm-applet &
  lock_screen: xautolock -time 10 -locker "ebenezer ui lock" &
  wallpaper_slideshow: ebenezer wallpaper random $wallpaper_dir --timeout $wallpaper_timeout
  dunst: dunst &
  pcmanfm: pcmanfm-qt --daemon-mode &
- setxkbmap and localectl set-x11-keymap the commands set the keyboard layout to Brazilian (BR) on a Linux system, first for the current section and then for X11 and terminals.
- polkit (PolicyKit) is a Linux framework for managing privileged operations, enabling non-root users to execute specified system functions securely without full
sudoaccess. It enhances security and usability by providing fine-grained access management to system services and GUI apps. - picom is a lightweight X11 compositor for Linux, enhancing visual effects like transparency, shadows, and fading animations. It's often used with tiling window managers like Qtile to improve aesthetics and reduce screen tearing.
- xautolock is a lightweight utility that automatically locks the X session after a period of inactivity.
- nm-applet is a graphical interface for NetworkManager that lets users manage network connections (Wi-Fi, Ethernet, VPN, and so on) via a system tray icon.
- dusnt is a lightweight, highly customizable notification daemon for Linux. It displays notifications in a small, unobtrusive pop-up format.
- pcmanfm is a lightweight, fast file manager for Linux, designed to be simple yet functional. It provides essential features like tabbed browsing, drag-and-drop support, and integrates well with minimal desktop environments, offering a clean interface and efficient file management.
- wallpaper_slideshow, as you can see, I created a widget package with CLI support called ebenezer that allows you to establish a procedure for changing your desktop wallpaper.
Commands
This section describes custom commands, which can be used as shortcut keys or to override commands in integrated features like as the lock screen or wallpaper.
commands:
  screenshot: flameshot gui --clipboard --path $home/Pictures/Screenshots
  screenshot_full: flameshot full --clipboard --path $home/Pictures/Screenshots
  change_wallpaper: ebenezer wallpaper set /usr/share/backgrounds/archlinux/
  mixer: pavucontrol # another option: kitty "pulsemixer"
  powermenu: ebenezer ui powermenu
  wallpaper_menu: ebenezer ui wallpaper-menu
  open_url: zen-browser --new-tab $url
  launcher: rofi -show drun -show-icons -theme $rofi_home/launcher.rasi
  launcher_windows: rofi -show window -show-icons -theme $rofi_home/launcher.rasi
  desktop_settings: ebenezer ui settings
Floating
Specifies which windows, identified by their class name or title, should automatically follow floating behavior, meaning they are not tiled but remain freely movable and resizable. This is particularly useful for dialog windows, pop-ups, and applications that don't work well in a tiling setting.
floating:
  wm_class:
    - pavucontrol
    - Arandr
    - Blueman-manager
    - Gpick
    - Kruler
    - Sxiv
    - Tor Browser
    - Wpa_gui
    - veromix
    - xtightvncviewer
    - gnome-calculator
    - ebenezer - configuration manager
    - "!floatingwindow"
    - Toplevel
    - kdenlive
  title:
    - ebenezer - configuration manager
Fonts
Define the default fonts for bars and widgets based on context. Qtile, GTK, and QT use owl files to define styles; see sections ./gtk-4.0,./gtk-3.0,./qt5ct, and ./qt6ct in my dotfiles repository.
fonts:
  font: Fira Code Nerd Font Bold
  font_regular: Fira Code Nerd Font Medium
  font_light: Fira Code Nerd Font Light
  font_strong: Fira Code Nerd Font Semibold
  font_strong_bold: Fira Code Nerd Font Bold
  font_size: 14
  font_icon: Fira Code Nerd Font Medium
  font_icon_size: 16
  font_arrow: Fira Code Nerd Font Medium
  font_arrow_size: 30
🚨 You must use Nerd Fonts, a typeface with patches designed for developers and featuring a large variety of glyphs (icons). Specifically, to include a large number of additional glyphs from popular 'iconic typefaces' like Font Awesome, Devicons, Octicons, and others.
Keybindings
This section details all shortcut keys or keybindings to launch a terminal, open a menu, alter window dimensions, change layout, take screenshots, use tools, or triggers anything.
The keybind could be the following actions list:
- terminal: Launches your preferred terminal, as defined in the environment section.
- spawn_command: Runs a custom command or a predefined one from the commands section.
- browser: Opens your preferred browser, as defined in the environment section.
- lock_screen: Locks the screen. By default, this uses the ebenezer ui lock command, which is based on a customized i3-lock. You can override this behavior in lock_screen.command.
- reload_config: Reloads the Qtile configuration.
- shutdown: Closes the Qtile session and returns to the session manager (e.g., LightDM, XDM, SDDM, GDM).
- next_layout: Switches to the next window layout based on the order defined in the layouts section.
- kill_window: Closes the currently active window. Since Qtile does not handle windows like GNOME or AwesomeWM, this command is required to close a window—expected behavior in a window manager.
- focus_(left|right|down|up): Moves the focus to the next window in the specified direction.
- fullscreen: Toggles full-screen mode for the active window.
- floating: Toggles floating mode for the active window.
- shuffle_(left|right|up|down): Moves the window in the specified direction.
- grow_(left|right|up|down): Increases the window size in the specified direction.
- reset_windows: Resets window sizes to their default layout dimensions.
- dropdown: Spawns a window as a drop-down, as defined in the scratchpads section.
keybindings:
- {name: Launch terminal, keys: $mod Return, action: terminal}
- {name: Launcher, keys: $mod shift Return, action: spawn_command, command: launcher}
- {name: Launch Window, keys: $mod control Tab, action: spawn_command, command: launcher_windows}
- {name: Web browser, keys: $mod b, action: browser}
- {name: Lock Screen, keys: $mod control x, action: lock_screen}

  # qtile keys
- {name: Reload the config, keys: $mod shift r, action: reload_config}
- {name: Shutdown Qtile, keys: $mod control q, action: shutdown}

  # window key
- {name: Toggle between layouts, keys: $mod Tab, action: next_layout}
- {name: Kill focused window, keys: $mod shift c, action: kill_window}
- {name: Move focus to left, keys: $mod h, action: focus_left}
- {name: Move focus to right, keys: $mod l, action: focus_right}
- {name: Move focus down, keys: $mod j, action: focus_down}
- {name: Move focus up, keys: $mod k, action: focus_up}
- {name: Move window focus to other window, keys: $mod space, action: focus_next}
- {name: Toggle fullscreen on the focused window, keys: $mod f, action: fullscreen}
- {name: Toggle floating on the focused window, keys: $mod t, action: floating}
- {name: Move window to the left, keys: $mod shift h, action: shuffle_left}
- {name: Move window to the right, keys: $mod shift l, action: shuffle_right}
- {name: Move window down, keys: $mod shift j, action: shuffle_down}
- {name: Move window up, keys: $mod shift k, action: shuffle_up}
- {name: Grow window to the left, keys: $mod control h, action: grow_left}
- {name: Grow window to the right, keys: $mod control l, action: grow_right}
- {name: Grow window down, keys: $mod control j, action: grow_down}
- {name: Grow window up, keys: $mod control k, action: grow_up}
- {name: Reset all window sizes, keys: $mod n, action: reset_windows}

  # screenshot
- {name: Take a screenshot, keys: print, action: spawn_command, command: screenshot}
- {name: Take a screenshot of the full desktop, keys: $mod print, action: spawn_command,
  command: screenshot_full}

  # desktop

  # desktop
- {name: Change wallpaper, group: settings, keys: $mod control w, action: spawn_command, command: change_wallpaper}
- {name: Desktop Settings, group: settings, keys: $mod control Escape, action: spawn_command, command: desktop_settings}
- {name: Keybindings help, group: settings, keys: $mod slash, action: dropdown, command: htop}

  # options
  # - { name: Spawn a command using a prompt widget, keys: $mod r, action: cmd }
Lock screen
This section describes how to configure the lock screen customization built on top of i3-lock. The changes displays a lock with transparency from the current desktop and includes some IT jokes from Reddit or Icanhazdadjoke.
lock_screen:
  command: ebenezer ui lock # default lock command
  timeout: 10
  font_size: 45
  font: Inter ExtraBold
  quote_font_size: 22
  quote_font_path: /usr/share/fonts/inter/IosevkaNerdFontMono-ExtraBoldOblique.ttf
  quote_font_path_alt: /usr/share/fonts/liberation/LiberationMono-Bold.ttf
  joke_providers: reddit,icanhazdad
  quote_foreground_color: '#7A1CAC'
  quote_text_color: '#F5F7F8'
  icanhazdad_joke_url: https://icanhazdadjoke.com/
  reddit_joke_url: https://www.reddit.com/r/ProgrammerDadJokes.json
  blurtype: '0x8'

I appreciate the idea to have random jokes on the lock screen. I was deeply inspired 🤩 by shinrai-dotfiles and created my own custom settings to make it flexible and performant.
Monitoring
You can assign colors for the threshold medium and high to your CPU and RAM, allowing you to easily detect when something is wrong in your system. 🤓 It's important to note that you can choose hex colors (#000) or defined colors (fg_normal, fg_red), which will be described in the next steps.
monitoring:
  default_color: fg_normal
  high_color: fg_orange
  medium_color: fg_yellow
  threshold_medium: 65
  threshold_high: 85
  burn: yes
Bar
Any desktop might have a bar, either at the top like MacOS, XFCE, Patheon or at the bottom like Windows, Deepin, Mint or Budgie. You may select, but it can't be right or left at the moment because I need to do some changes to this design to have a more appealing appearance, just like Ubuntu docks.
In addition to defining bar dimensions, you can choose and modify which widgets should appear in the bar in what order. Would be wonderful drag-and-drop design, but yaml works, trust me 🫶🏻🥹❤️🩹.
bar:
  position: top
  size: 34
  widgets:
  - type: group_box
    margin_y: 3
    margin_x: 3
    padding: 0
    borderwidth: 0
    active: fg_normal
    inactive: fg_normal
    this_current_screen_border: bg_topbar_selected
    this_screen_border: fg_blue
    other_current_screen_border: bg_topbar_selected
    highlight_color: bg_topbar_selected
    highlight_method: text
    foreground: fg_normal
    rounded: false
    urgent_alert_method: border
    urgent_border: fg_urgent
  - type: separator
  - type: task_list
  - type: weather
  - type: spacer
    length: 5
  - type: clock
  - type: spacer
    length: 5
  - type: 'notification'
    animated: true
  - type: spacer
    length: stretch
  - type: arrow
  - type: github
  - type: thermal
    sensor:
      threshold_medium: 55
      threshold_high: 65
  - type: cpu
    sensor:
      threshold_medium: 65
      threshold_high: 85
  - type: memory
    sensor:
      threshold_medium: 65
      threshold_high: 85
  - type: battery
  - type: volume
  - type: powermenu
  - type: hidden_tray
  - type: current_layout
Scratchpads
This section defines the Qtile Dropdowns, which enable you to customize the window location, dimensions, and alpha settings to create a pop-up-like experience. The following defines a dropdown for NeoFetch, AudioMixer, and Keybindings support.
scratchpads:
  dropdowns:
    neofetch:
      command: neofetch
      args:
        opacity: 0.8
        width: 0.6
        height: 0.6
        x: 0.20
        y: 0.20
    keybindings_help:
      command: keybindings_help
      args:
        opacity: 0.8
        width: 1
        height: 1
        x: 0
        y: 0
    mixer:
      command: mixer
      args:
        opacity: 1
        width: 0.4
        height: 0.6
        x: 0.3
        y: 0.1
    blueman:
      command: blueman
      args:
        opacity: 1
        width: 0.05
        height: 0.6
        x: 0.35
        y: 0.1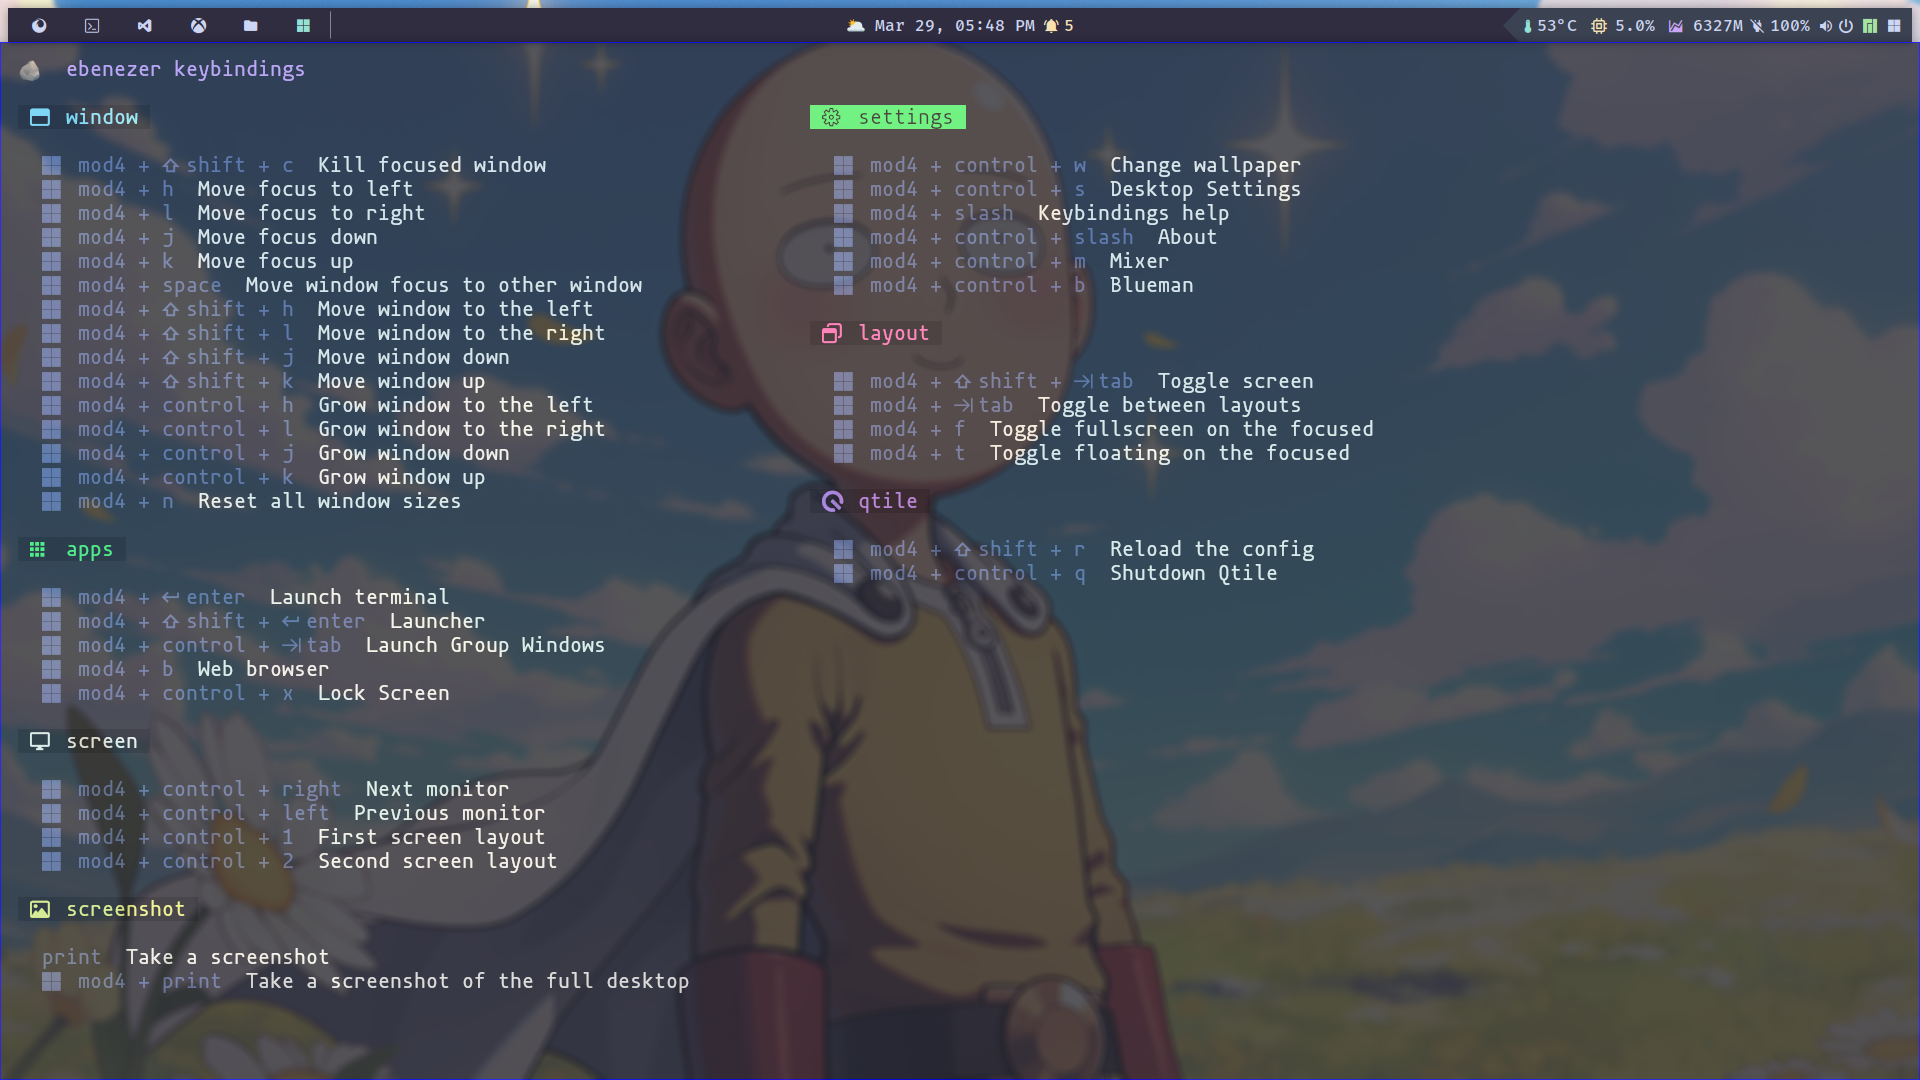
Widgets
Qtile provides a variety of widgets, but I found it necessary to create custom widgets to support my visual appealing desktop. For example, the CPU widget works by default, but I would want to monitor with colors, so I made changes. Layout widget works, but it was an image, and I liked the idea of using font icons, so I refactored. Task list works as well, but it is not font icon, so I added a new widget, volume, weather widget, and notifications widget, so I made a lot of improvements, but now my window manager looks as I desire it to 🤩.
Here's an example of simple widget customization: the ColorizedCPUWidget inherits from the CPU and makes color-friendly adjustments.
from libqtile import widget
from libqtile.widget import CPU
from ebenezer.config.settings import AppSettings
from ebenezer.widgets.formatter import burn_text
from ebenezer.widgets.helpers.args import build_widget_args
class ColorizedCPUWidget(CPU):
def __init__(self, **config):
settings = config.pop("settings")
super().__init__(**config)
self.high_color = settings.colors.get_color(settings.monitoring.high_color)
self.medium_color = settings.colors.get_color(settings.monitoring.medium_color)
self.default_color = settings.colors.get_color(
settings.monitoring.default_color
)
self.threshold_medium = config.get(
"threshold_medium", settings.monitoring.threshold_medium
)
self.threshold_high = config.get(
"threshold_high", settings.monitoring.threshold_high
)
def poll(self):
text = CPU.poll(self)
cpu = float(text.replace("%", ""))
if cpu > self.threshold_high:
self.foreground = self.high_color
text = burn_text(text)
elif cpu > self.threshold_medium:
self.foreground = self.medium_color
else:
self.foreground = self.default_color
return text
def build_cpu_widget(settings: AppSettings, kwargs: dict):
default_icon_args = {
"font": settings.fonts.font_icon,
"fontsize": settings.fonts.font_icon_size,
"padding": 2,
"foreground": settings.colors.fg_yellow,
"background": settings.colors.bg_topbar_arrow,
}
icon_args = build_widget_args(
settings,
default_icon_args,
kwargs.get("icon", {}),
)
default_args = {
"settings": settings,
"threshold_medium": settings.monitoring.threshold_medium,
"threshold_high": settings.monitoring.threshold_high,
"font": settings.fonts.font_icon,
"fontsize": settings.fonts.font_icon_size,
"format": "{load_percent}% ",
"padding": 2,
"foreground": settings.colors.fg_normal,
"background": settings.colors.bg_topbar_arrow,
}
args = build_widget_args(settings, default_args, kwargs.get("sensor", {}))
return [
widget.TextBox(f"{icon_args.pop("text", "")} ", **icon_args),
ColorizedCPUWidget(**args),
]
It's time to show the desktop working right now...

Look and feel
I created this short video to demonstrate the desktop look, feel, and functions...
Code
💡 Feel free to clone this dotfile repository, which contains related files:

That's it

In this post, I discuss my experience with Qtile, my dotfiles, and the library I made to improve my desktop experience, Qtile Ebenezer.
I hope this information helps you increase your desktop productivity. Please feel free to share your questions or experiences—I'd love ❤️ to hear 👂 from you!
Keep your kernel 🧠 updated, and God bless 🕊️ you and your family!
]]>Today I'll show you how to utilize Traefik locally with Kubernetes ☸️ to publish services using route matching and middlewares in an excellent approach.
Requirements
We require K3s to run containers locally; if you want an introduction, I wrote the following articles:

We could also use minikube, but it didn't function well with Traefik when I tried to install CRDS and use middleware, so I'll look into it in another post.
Podman lover ❤️?
If you enjoy Podman, this is for you. Take a look after this post if you want to use podman instead of Kubernetes ☸️.

What is Traefik?
Traefik is a modern HTTP reverse proxy and load balancer developed in Go that is suited for microservice architecture. It is commonly used in containerized environments, such as Docker and Kubernetes.
Traefik dynamically detects services as they are introduced to the infrastructure and routes traffic to them, making applications easier to manage and grow.
Major features:
- Automatic Service Discovery: Traefik can detect new services as they are introduced to your infrastructure, removing the need for human configuration.
- Dynamic Configuration: It can reorganize itself as services scale up or down, making it ideal for dynamic contexts like as container orchestration platforms.
- Load Balancing: Traefik includes built-in load balancing capabilities for distributing incoming traffic over many instances of a service.
- Automatic TLS: It may supply TLS certificates from Let's Encrypt, enabling HTTPS by default without requiring manual configuration.
- Dashboard: Traefik includes a web dashboard and a RESTful API, which enable operators to monitor and manage traffic routing and configuration.
- Middleware Support: It supports a number of middleware plugins for features like authentication, rate limiting, and request rewriting.
- Multiple Backends: Traefik can route traffic to multiple backend services based on various criteria like path, headers, or domain names.
Goals 🎯
The goal is to create an example of using K3s to offer a node Kubernetes with Traefik; after provisioning, we will launch apps at ingress while enabling some Traefik middleware, demonstrating its true power 🔥.
K3s uses Traefik as the routing edge by default, so all you need to do is configure services and modify deployments.
🔥 Brace yourselves, deploy is coming...

Setting Up k3s with Traefik
Firstly, ensuring that K3s and Traefik are running:
sudo systemctl start k3s

sudo systemctl status k3s
#  Active: active (running)
Let us check to see whether pods are running properly.
kubectl get pods -Akube-system coredns-ccb96694c-h6rp6 1/1 Running 0 30h
kube-system helm-install-traefik-crd-hskk6 0/1 Completed 0 30h
kube-system helm-install-traefik-svhhm 0/1 Completed 1 30h
kube-system local-path-provisioner-5cf85fd84d-p44gg 1/1 Running 0 30h
kube-system metrics-server-5985cbc9d7-9wfgz 1/1 Running 0 30h
kube-system svclb-traefik-42c2404f-kvm8r 3/3 Running 0 93s
kube-system traefik-5d45fc8cc9-2gxwm 1/1 Running 0 30hThen let's check HTTP requests to Traefik; it should return 404 because there is no service routed at ingress.
curl http://localhost
# 404 page not found
Setting up local domains
Please adds to /etc/hosts file, the domains (whoami.local-k3s and traefik.local-k3s)
echo "127.0.0.1 whoami.local-k3s traefik.local-k3s" | sudo tee -a /etc/hostsDeploying WhoAmI
Now it's time to set up a basic pod that I used in a previous post to respond to HTTP requests and allow us to understand how the Kubernetes ☸️ stack works.
Let's create some yaml files:
- whoami-middleware.yaml
This file defines a middleware that will be used in a Kubernetes service. The middleware adds a custom header to any request containing the header X-Origin.
apiVersion: traefik.containo.us/v1alpha1
kind: Middleware
metadata:
  name: whoami-response-headers
  namespace: default
spec:
  headers:
    customRequestHeaders:
X-Origin: "whoami-kubernetes-local"- whoami-deployment.yaml
That file describes two components: Kubernetes ☸️ service and deployment. The pod uses port 80, and the service is the same, with only one replica.
apiVersion: v1
kind: Service
metadata:
  name: whoami
  namespace: default
spec:
  ports:
    - port: 80
      targetPort: 80
  selector:
    app: whoami
---
apiVersion: apps/v1
kind: Deployment
metadata:
  name: whoami
  namespace: default
spec:
  replicas: 1
  selector:
    matchLabels:
      app: whoami
  template:
    metadata:
      labels:
        app: whoami
    spec:
      containers:
      - name: whoami
        image: traefik/whoami
        ports:
        - containerPort: 80
- whoami-ingress.yaml
Here we apply the rules to ingress find our service; this match uses the host as a rule and applies the previously established middleware.
apiVersion: traefik.containo.us/v1alpha1
kind: IngressRoute
metadata:
  name: whoami
  namespace: default
spec:
  entryPoints:
    - web
  routes:
  - match: Host(`whoami.local-k3s`)
    kind: Rule
    services:
      - name: whoami
        port: 80
    middlewares:
      - name: whoami-response-headers
Now, let’s put these definitions into action!
kubectl apply -f whoami-deployment.yaml \
              -f whoami-middleware.yaml \
              -f whoami-ingress.yaml
Expected response:
service/whoami created
deployment.apps/whoami created
middleware.traefik.containo.us/whoami-response-headers created
ingressroute.traefik.containo.us/whoami created
If everything goes well, we will be able to connect to your service via host on port 80 http://whoami.local-k3s/.
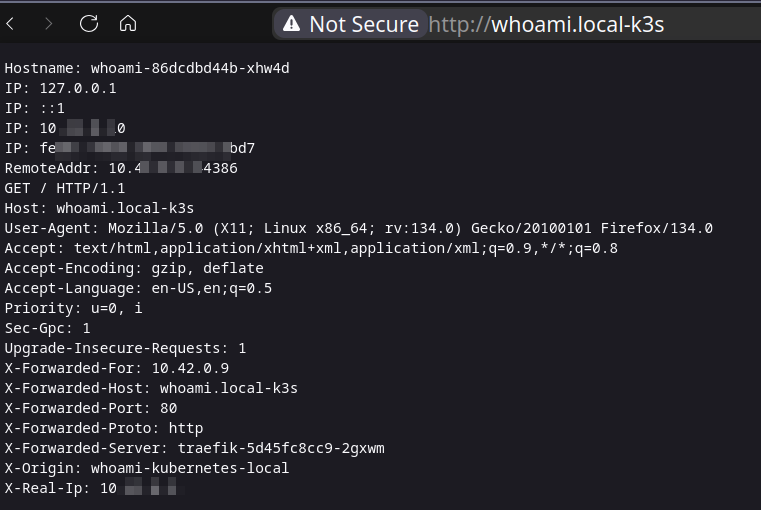
As we can see, when X-Origin is applied to a request, whoami returns all http request headers, which is great for testing 🚀.
Deploying the Traefik Dashboard
The Traefik Dashboard gives real-time visibility into your Kubernetes ☸️ ingress routes, services, and middleware. You may monitor active routes, examine the status of load balancing, and validate middleware setups such as authentication and header updates. It also lets you inspect TLS certificates, monitor backend health, and troubleshoot routing difficulties. You can improve security by protecting the dashboard with Basic Authentication or other access constraints.
Here I'll show you how to enable Traefik Dashboard. By default, there is no authentication, so it's not a good idea to enable at ingress without some security; my proposal is that this type of tool have limited access to a VPN or IP allow list.
Patch Traefik Services
K3s does not expose port 9000 at service, which is required for API and dashboard, therefore we need to patch.
- traefik-service-patch.yaml
spec:
  ports:
    - name: web
      nodePort: 32227
      port: 80
      protocol: TCP
      targetPort: web
    - name: websecure
      nodePort: 30411
      port: 443
      protocol: TCP
      targetPort: websecure
    - name: traefik
      port: 9000
      protocol: TCP
      targetPort: traefik
The following command applies the patch to the Traefik service that is currently running:
kubectl patch service traefik -n kube-system --patch "$(cat traefik-service-patch.yaml)"Let's inspect the port listening:
kubectl get services -n kube-system The expected result:
NAME             TYPE           CLUSTER-IP     EXTERNAL-IP   PORT(S)                                     AGE
kube-dns         ClusterIP      10.43.0.10     <none>        53/UDP,53/TCP,9153/TCP                      31h
metrics-server   ClusterIP      10.43.228.25   <none>        443/TCP                                     31h
traefik          LoadBalancer   10.43.67.137   10.0.0.143    80:32227/TCP,443:30411/TCP,9000:31979/TCP   31h
We now need some files to route Traefik Dasboard across ingress in secure mode.
- traefik-auth-middleware.yaml
This file defines the middleware HTTP basic authentication.
apiVersion: traefik.containo.us/v1alpha1
kind: Middleware
metadata:
  name: traefik-dashboard-auth-middleware
  namespace: default
spec:
  basicAuth:
secret: traefik-dashboard-auth-secret- traefik-secret.yaml
We define the value of HTTP basic authentication, which represents user: foo and password: bar. Please do not use this in production 😂 since it is very powerful 💪.
apiVersion: v1
kind: Secret
metadata:
  name: traefik-dashboard-auth-secret
  namespace: default
data:
users: Zm9vOntTSEF9WXMyM0FnLzVJT1dxWkN3OVFHYVZEZEh3SDAwPQo=- traefik-dashboard-ingress.yaml
As with the previous ingress route, the match is made by host and is now protected by middleware HTTP basic authentication.
apiVersion: traefik.containo.us/v1alpha1
kind: IngressRoute
metadata:
  name: traefik-dashboard
  namespace: default
spec:
  entryPoints:
    - web
  routes:
    - match: Host(`traefik.local-k3s`)
      kind: Rule
      middlewares:
        - name: traefik-dashboard-auth-middleware
          namespace: default
      services:
        - name: api@internal
          kind: TraefikService
It's time to put these definitions into practice!
kubectl apply -f traefik-auth-middleware.yaml \
              -f traefik-secret.yaml \
              -f traefik-dashboard-ingress.yaml
Expected result:
middleware.traefik.containo.us/traefik-dashboard-auth-middleware created
secret/traefik-dashboard-auth-secret created
ingressroute.traefik.containo.us/traefik-dashboard created
Now we can access the Dashboard (http://traefik.local-k3s), but it is secured by the HTTP basic authentication credentials foo:bar.
It works, but I would never propose making this access public; instead, use a VPN to protect yourself 🧐.
Another ways to enable Dashboard
Using forward
This method allows you to route the Traefik and access the dashboard at port 9000, but keep in mind that there is no authentication. This command is running in the foreground, therefore closing the terminal will cause the forward to stop.
kubectl port-forward -n kube-system deployment/traefik 9000:9000
Editing service to expose port 9000 (manually)
The following command will edit the service with a file, which is handy for local testing.
kubectl edit services traefik -n kube-systemAdding these specifications, port 9000 will be listening:
spec:
    ports:
    - name: traefik
      port: 9000
      targetPort: 9000
Works, however there is no authentication, therefore it is not ready for production. 😉
Code
💡 Feel free to clone this repository, which contains related files:

That's all
In this post, we set up a Traefik-routed service over Ingress, and I demonstrate how to enable the Traefik dashboard in a variety of ways, the most significant of which is in a secure way, avoiding any issues caused by exposing your settings.
I hope this article helps you create your Kubernetes ☸️ stack with Traefik, and I'd love ❤️ to hear 👂 your questions or share your experiences, that's it.

Don't forget to upgrade your kernel 🧠; God bless 🕊️ you and your family.]]>

Há algum tempo, os repositórios deixaram de ser apenas depósitos de código e assumiram a função de centralizar a documentação, o fluxo de testes e a publicação em produção, entre outras obrigações. Com todas essas obrigações, também temos a responsabilidade de proteger valores importantes do nosso repositório, como a senha do banco de dados, a chave de autenticação e até mesmo a chave usada apenas para staging, que pode parecer inofensiva. 🐱 🦁
Essa não é uma prática recomendada, conforme mencionado em 12 Fatores, onde se enfatiza que as configurações devem ser mantidas em variáveis de ambiente e que uma aplicação deve ser projetada para funcionar em qualquer ambiente. No entanto, reconhecemos que, sem uma verificação periódica, pode ocorrer um vazamento não intencional. Subimos aquele arquivo com alguma referência de produção relevante ou não. Às vezes, isso acontece de maneira proposital 🥺, pois é mais fácil e rápido subir aquela variável diretamente em um arquivo de configuração ou Containerfile 🐳.
Como podemos prevenir?
Este artigo serve como uma iniciativa para a prevenção de segredos em repositórios, estruturando um projeto desde o inicio para prevenir falhas básicas de segurança. Lamentavelmente, vivemos em um mundo onde qualquer falha pode resultar em danos para indivíduos ou empresas, proporcionando lucro fácil para criminosos 🥷🏻💸🤑💰.
O Gitleaks é uma solução viável e de código aberto ❤️ que permite detectar vazamentos em nossos repositórios git.
Como funciona?
O Gitleaks é uma ferramenta que a cada execução avalia a nível de diretório ou de histórico com base no git, verificando se existem vazamentos no repositório, estas duas formas são importantes, e podemos utilizar da seguinte forma.
- Novas alterações podem ser analisadas no nível do repositório, onde podemos determinar se um novo código violou alguma regra ou se houve vazamento de dados.
- Ao realizar a varredura por pipeline, é aconselhável analisar o repositório e seu histórico, pois as regras podem ser atualizadas e um novo vazamento pode ser detectado, ou durante a implementação do gitleaks, podem ser detectados apontamentos baseados no histórico.
Bora ☕ !

.gitleaks.toml
Primeiramente, crie um arquivo chamado .gitleaks.toml, onde adicionaremos as regras do nosso scan gitleaks. É comum termos falsos positivos, por isso, a ferramenta oferece métodos para ignorar arquivos ou "matches" que possam provocar essa situação.
Aqui um exemplo:
[extend]
useDefault = true

[allowlist]
description = "global allow list"
paths = [
  '''gitleaks\.toml''',
  '''gitleaks-report\.json''',
  '''\.env$''',
  '''(.*?)(jpg|gif|doc)''',
]

[[rules]]
id="aws-access-key"
description = "AWS Access Key"
regex = '''AKIA[0-9A-Z]{16}'''
tags = ["key", "AWS"]

[[rules]]
id="aws-access-secret"
description = "AWS Secret Key"
regex = '''(?i)aws_secret_access_key\s*=\s*[A-Za-z0-9/+=]{40}'''
tags = ["key", "AWS"]
- extend, indica que é uma extensão da configuração padrão.
- allowlist, a lista de permissões estabelece regras permissivas, como, por exemplo os arquivos que não devem ser levados em conta no escaneamento.
- rules, é possível estabelecer várias regras para detecção de vazamento de dados sensíveis.
Pronto, esta foi uma abordagem sucinta à configuração, onde podemos encontrar exemplos mais detalhados diretamente na documentação do Gitleaks, na seção "Configurações".
Arquivo com dados sensíveis
.env.sample
MY_WEAK_PASSWORD=X
MY_STRONG_PASSWORD=QJJ0S81ogYX5iJebUM4LN1FOFFuQKo0B
AWS_ACCESS_KEY_ID=AKIAIOSFODNN7EXAMPLE
AWS_SECRET_ACCESS_KEY=wJalrXUtnFEMI/K7MDENG/bPxRfiCYEXAMPLEKEY
Executando em um diretório
Com a configuração concluída e um arquivo sensível em mãos, podemos iniciar o escaneamento.
docker run --rm -v $(pwd):/repo \
    zricethezav/gitleaks:latest \
    dir /repo \
    --gitleaks-ignore-path .gitleaksignore \
    --config /repo/.gitleaks.toml \
    --report-format json \
    --report-path /repo/gitleaks-report.json \
    -v
O resultado esperado deve identificar vazamentos.
Finding:     MY_STRONG_PASSWORD=QJJ0S81ogYX5iJebUM4LN1FOFFuQKo0B
Secret:      QJJ0S81ogYX5iJebUM4LN1FOFFuQKo0B
RuleID:      generic-api-key
Entropy:     4.452819
File:        /repo/.env.sample
Line:        2
Fingerprint: /repo/.env.sample:generic-api-key:2

12:03PM INF scan completed in 2.19ms
12:03PM WRN leaks found: 3
Executando em um repositório git
Anteriormente, utilizamos o modo diretório, que não leva em conta os históricos do git. O comando a seguir examina todo o histórico do repositório. Não aconselho a execução deste em um pre-commit devido à performance e desnecessário analisar o histórico a cada alteração. Este procedimento é apropriado para um pipeline de execução.
docker run --rm -v $(pwd):/repo \
    zricethezav/gitleaks:latest \
    detect --source /repo \
    --config /repo/.gitleaks.toml \
    --report-format json \
    --report-path /repo/gitleaks-report.json \
    -v
Como corrigir?
É necessário determinar se o vazamento é significativo. Se for, ele deve ser removido do repositório. Se for detectado é aconselhável redefinir a senha ou a chave. Podemos também realizar reflog, rebase no repositório para eliminar completamente o vazamento. Também podemos usar o .gitleaksignore para ignorar commits ou até mesmo ignorar dados não sensíveis que foram detectados no escaneamento.
Neste cenário, presumimos que este apontamento já foi enviado ao repositório anteriormente e desejamos ignorar o mesmo. Para isso crie um arquivo chamado .gitleaksignore.
SEU_COMMIT_HASH_AQUI:.env.sample:generic-api-key:2
Extras
Make
Adotei essa prática em meus projetos há algum tempo, uma herança do que aprendi em Golang 🦫. O Makefile é um arquivo utilizado por um utilitário chamado make, um instrumento de automação de compilação e gestão de dependências, amplamente utilizado em projetos de software, particularmente em linguagens como C e C++. Além disso, pode ser aplicado em outras tarefas de automação. Se precisamos executar comandos shell, o Makefile nos ajuda a organizar e centralizar a execução dos nossos scripts.
# Define the shell for the make process
SHELL := /bin/bash

REPO_PATH := $(PWD)
GITLEAKS_IMAGE := zricethezav/gitleaks:latest
GITLEAKS_CONFIG := $(REPO_PATH)/.gitleaks.toml
GITLEAKS_REPORT := $(REPO_PATH)/gitleaks-report.json

pre-commit: leaks

leaks-history:
	docker run --rm \
    -v $(REPO_PATH):/repo \
    $(GITLEAKS_IMAGE) \
    detect --source /repo \
    --config /repo/.gitleaks.toml \
    --report-format json \
    --report-path /repo/gitleaks-report.json \
    -v

leaks:
	docker run --rm \
    -v $(REPO_PATH):/repo \
    $(GITLEAKS_IMAGE) \
    dir /repo \
    --config /repo/.gitleaks.toml \
    -v

leaks-report:
	docker run --rm \
    -v $(REPO_PATH):/repo \
    $(GITLEAKS_IMAGE) \
    dir /repo \
    --config /repo/.gitleaks.toml \
    --report-format json \
    --report-path /repo/gitleaks-report.json \
    -v

help:
	@echo "Makefile Commands:"
	@echo "  pre-commit        Run gitleaks-history check before commit"
	@echo "  leaks-history    Run gitleaks history detection on the repository"
	@echo "  leaks            Run gitleaks detection on the repository directory"
	@echo "  leaks-report     Run gitleaks with a report on the repository directory"
	@echo "  help             Show this help message"

%:
	@echo "Unknown target '$@'. Use 'make help' to see available commands."
	@$(MAKE) help

```
Github Actions
O Gitleaks tem um action oficial gratuito para projetos. Projetos abertos não necessitam de registro para utilizar o pipeline, enquanto empresas necessitam desse registro. Somente o uso do pipeline otimizado requer registro, no entanto, o projeto é de código aberto e você pode executar suas ações através do docker diretamente em uma Action, bem como localmente, se necessário.
Segue um exemplo de Github Actions utilizando o padrão disponibilizado pelo Gitleaks:
name: Gitleaks Scan
run-name: Gitleaks Scan in [${{ github.ref_name }}] @${{ github.actor }}

on:
  push:
    branches:
      - main
  pull_request:
    branches:
      - main

jobs:
  gitleaks:
    runs-on: ubuntu-latest

    steps:
      - name: Checkout code
        uses: actions/checkout@v4
        with:
          fetch-depth: 0

      - name: Run Gitleaks
        uses: gitleaks/gitleaks-action@v2
        with:
          github_token: ${{ secrets.GITHUB_TOKEN }}
          args: detect --report-format json --report-path gitleaks-report.json

      - name: Upload Gitleaks report
        uses: actions/upload-artifact@v3
        with:
          name: gitleaks-report
          path: gitleaks-report.json
Pre-commit
Prevenir vazamentos é crucial, portanto, um hook pre-commit auxilia na identificação de vazamentos antes da alteração chegar ao repositório a cada "commit".
- pre-commit
#!/bin/sh

make pre-commit

RESULT=$?

if [ $RESULT -ne 0 ]; then
  echo "Pre-commit checks failed. Commit aborted."
  exit 1
fi

exit 0
O comando a seguir estabelece um gatilho que permite a realização de uma varredura a cada atualização de código, conhecida como "commit".
ln -sf $(pwd)/pre-commit $(pwd)/.git/hooks/pre-commit
Repositório
Como sempre, a implementação está no meu repositório do Github, que você pode baixar e testar com o Gitleaks. Para mais informações, consulte o README do projeto.
 williampsena
E isso é tudo pessoal!
No repositório você pode validar a execução dos Github Actions e entender um pouco mais na prática como tornar seu código seguro. Espero que tenha entregue o meu tesouro e que esta ajuda tenha sido útil e edificadora, mantendo seu kernel 🧠 atualizado!
Mateus 6:21-23 Pois, onde estiver o seu tesouro, ali também estará o seu coração. ― Os olhos são a lâmpada do corpo. Portanto, se os seus olhos forem bons, todo o seu corpo estará cheio de luz. Mas, se os seus olhos forem maus, todo o seu corpo estará cheio de trevas. Portanto, se a luz que está dentro de você são trevas, quão grandes trevas são!
Referências
]]>Today I'll go over how to write "exitable/crasheable" tests in the Go language. This question emerged when I attempted to write my tests in the same way that I did in other languages. Before I show you how I develop some tests, I'd want to share some useful code design tips.
Go error handing ❌
My first language experience was procedural, and then I moved on to object-oriented programming, so on the Go side, we have rules to handle errors in order to avoid problems during pipeline execution and testing; thus, with my limited Go skills, I would argue that you should not use panic functions at all or log.Fatal, which results in an os.exit since you are interrupting the execution of your program, and you may not want this behavior to be shared across all of your packages.
Assume you're consuming a package that could crash, and your system isn't expecting it, so every crash means a worker, server, or pod is offline. If we are working with a http server, it will most likely send an internal server error for this piece of code is isolated. Of course, you can handle issues at the error entry point, but I believe this is not the best solution because it adds 🦨 smell to your code. This is equivalent to failing to separate your ♻️ recyclable garbage.
I understand that return error for all functions can be difficult to handle code; at Elixir, we have pattern matching to deal with error verbosity, but again, return error is much better than panic or interrupting; explicit is better than implicit; for a long time, I used to prefer less magic than the past; I used to love the way Rails, Django, ASP.NET, and Spring does things, but after lost nights 💤 and much coffee ☕, I choose simplicity at some places of code design.
Writing a calculator
Let's develop a calculator 🧮 using the panic and exit functions to show how program interruption can be troubling during testing.
- main.go
package main

import (
	"log"
	"os"
	"strconv"
)

// This function is a minimal implementation of the calculator
func calculate(args []string) float64 {
	if len(args) < 3 {
		panic("invalid arguments")
	}

	x, err := strconv.Atoi(args[0])

	if err != nil {
		panic(err)
	}

	y, err := strconv.Atoi(args[2])

	if err != nil {
		panic(err)
	}

	var r float64

	switch args[1] {
	case "+":
		r = float64(x + y)
	case "-":
		r = float64(x - y)
	case "x":
		r = float64(x * y)
	case "/":
		r = float64(x / y)
	default:
		log.Fatal("invalid operation")
	}

	return r
}

func main() {
	args := os.Args[1:]

	r := calculate(args)

	log.Printf("🟰  %.2f\n", r)
}
- Panic functions are used when numbers cannot be parsed or the required arguments are less than three in length.
- When an operation does not exist, the program sends a log.Fatal that causes os.exit.
Then let's run the application.
# installing deps
go mod download

go run main.go 2 - 9
# 🟰 -7

go run main.go 5 + 2
# 🟰 7

go run main.go 7 x 7
# 🟰 49

go run main.go 49 / 7
# 🟰  7.00
Before writing tests, we need some functions to support them.
- test.go
package main

import (
	"bytes"
	"fmt"
	"os"
	"os/exec"
	"testing"
)

// Run a fork test that may crash using os.exit.
func RunForkTest(t *testing.T, testName string) (string, string, error) {
	cmd := exec.Command(os.Args[0], fmt.Sprintf("-test.run=%v", testName))
	cmd.Env = append(os.Environ(), "FORK=1")

	var stdoutB, stderrB bytes.Buffer
	cmd.Stdout = &stdoutB
	cmd.Stderr = &stderrB

	err := cmd.Run()

	return stdoutB.String(), stderrB.String(), err
}
- The RunForkTests function runs a specified test in a fork process and allows you to assert stdout and stderr.
So right now is the time for coding tests

💡Okay, we've reached the main goal: create crashable tests. The most common return execution status is frequently 0 for success and 1 for error. This status indicates whether the test was successful or failed.
To avoid test crashes caused by panic or os.exit, tests will run in a fork process. When a crash happens, the fork process terminates and the main progress matches the progress status and the related stdout and stderr files.
- main_test.go
package main

import (
	"bytes"
	"log"
	"os"
	"testing"

	"github.com/stretchr/testify/assert"
)

func TestCalculateSum(t *testing.T) {
	r := calculate([]string{"5", "+", "5"})

	assert.Equal(t, float64(10), r)
}

func TestCalculateSub(t *testing.T) {
	r := calculate([]string{"5", "-", "15"})

	assert.Equal(t, float64(-10), r)
}

func TestCalculateMult(t *testing.T) {
	r := calculate([]string{"10", "x", "10"})

	assert.Equal(t, float64(100), r)
}

func TestCalculateDiv(t *testing.T) {
	r := calculate([]string{"100", "/", "10"})

	assert.Equal(t, float64(10), r)
}

func TestCalculateWithPanic(t *testing.T) {
	defer func() {
		err := recover().(error)
		if err != nil {
			assert.Contains(t, err.Error(), "parsing \"B\": invalid syntax")
		}
	}()

	calculate([]string{"10", "/", "B"})

	t.Errorf("😳 The panic function is not called.")
}

func TestMainWithPanicWithFork(t *testing.T) {
	if os.Getenv("FORK") == "1" {
		calculate([]string{"A", "/", "10"})
	}

	stdout, stderr, err := RunForkTest(t, "TestMainWithPanicWithFork")

	assert.Equal(t, err.Error(), "exit status 2")
	assert.Contains(t, stderr, "parsing \"A\": invalid syntax")
	assert.Contains(t, stdout, "FAIL")
}

func TestMainWithExit(t *testing.T) {
	oldStdout := os.Stdout
	oldArgs := os.Args

	var buf bytes.Buffer
	log.SetOutput(&buf)

	defer func() {
		os.Args = oldArgs
		os.Stdout = oldStdout
	}()

	os.Args = []string{"", "10", "x", "10"}
	main()

	log.SetOutput(os.Stderr)

	assert.Contains(t, buf.String(), "🟰  100.00")
}
This is the test execution 🔥.
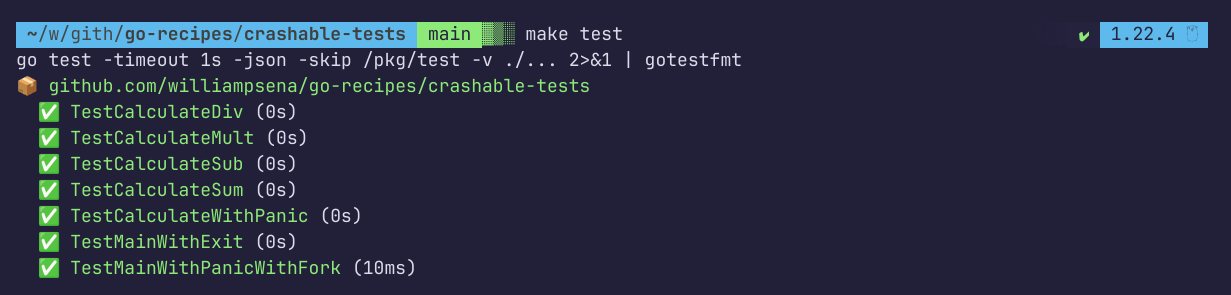
- I employ the package gotestfmt to produce test experiences similar to those we have in other languages. Remember, we develop code for humans, therefore colors and emoji are extremely important 🙄.
Code
💡 Feel free to clone this repository, which contains related files:
williampsenaThat's all folks
In this article, I describe how to handle tests that use panic or os.exit; however, I recommend you avoid using this behavior in all places of code; instead, prefer return error:
package main

type func calculate(args []string) (float64, error)
Let the main responsible to panic or exit the application and writing these types of tests can be difficult.
Please provide feedback so that we can keep our 🧠 kernel up to date.
I hope I can assist you with writing tests or resolving your worries about structuring your code for error handling, as well as remind you to stay focused on your goal:
🕊️ "Many are the plans in the mind of a man, but it is the purpose of the Lord that will stand" . Proverbs 19:21.]]>
Há algum tempo atrás, visando manter meu estilo generalista, mergulhei nos estudos de Go. Estava estudando, mas nunca tive a oportunidade de experimentar um projeto em produção para ajustar o treino ao jogo ⚽.
Durante essa jornada tive o prazer e o impacto de conhecer diferentes técnicas para resolver um problema. Sem dúvidas, me apeguei ao conceito da linguagem e decidi trocar uma aplicação pessoal que fiz em Elixir para Go. O objetivo deste artigo não é comparar 🫡, esse é um comentário para demonstrar o quanto cheguei à produtividade e maturidade que eu esperava.
Godoc
Deixando de lado as comparações! Assim como o Pyhton possui o pydoc, o Node.js possui o ESDoc. O Go também disponibiliza o pacote godoc para extração de documentação, o qual converte todos os comentários estruturados em uma versão HTML.
Sempre gostei dessa abordagem. Eu pessoalmente não vejo problemas entre o código e a documentação. Devemos nos lembrar que, assim como o Chat GPT, produzimos códigos para outros seres humanos. Por último, é importante manter a documentação atualizada.
O estilo de documentação é simplificado e sem muitas regras, deixando que você defina a sua forma de documentar os argumentos da função e seu retorno.
Bora para a prática!
Iremos criar uma simples aplicação http documentada que devolve dados de cartões aleatórios para o super hacker da geração, que usa a palavra "hack" para tudo, poder realizar transações e receber uma compra negada na sua cara.

Dependências
Iremos instalar duas bibliotecas oficiais o godoc e o pkgsite, que permitem a conversão dos comentários para HTML.
go install -v golang.org/x/tools/cmd/godoc@latest
go install golang.org/x/pkgsite/cmd/pkgsite@latest
Códigos
- go.mod
💬 O pacote gofakeit oferece diversas implementações para gerar informações aleatórias, o que torna a preparação de ambientes de teste e fixtures mais fácil.
module github.com/williampsena/go-recipes/doc-app-example

go 1.22.4

require github.com/brianvoe/gofakeit/v7 v7.0.3 // indirect
- main.go
// This package represents the application command for starting a web server.
package main

import (
	"github.com/brianvoe/gofakeit/v7"
	"github.com/williampsena/go-recipes/doc-app-example/web"
)

// This function is responsible for setting up the program before it runs
func init() {
	gofakeit.Seed(0)
}

// Application entrypoint
func main() {
	svr := web.BuildServer()
	web.ListenAndServe(svr)
}
- Makefile
SHELL=bash

dev:
	go run main.go

docs-godoc:
	godoc -http=:4444

docs-pkgsite:
	pkgsite -http=:4444
- web/server.go
// This package contains web server structures and functions responsible for handling HTTP application.
package web

import (
	"fmt"
	"net/http"
)

// Create an application web server mux with routes established
func BuildServer() *http.ServeMux {
	mux := http.NewServeMux()

	mux.HandleFunc("GET /health", HealthCheckEndpoint)
	mux.HandleFunc("GET /cards", CardGeneratorEndpoint)

	return mux
}

// Listening web server on port 4000
func ListenAndServe(mux *http.ServeMux) {
	fmt.Println("✅ The sever is listening at port 4000")
	http.ListenAndServe("localhost:4000", mux)
}
- web/cards.go
package web

import (
	"encoding/json"
	"fmt"
	"net/http"

	"github.com/brianvoe/gofakeit/v7"
)

// Struct responsible for holding all card data, such as the holder's name and card number
type Card struct {
	HolderName string `json:"holder_name"` // card holder name
	Type       string `json:"type"`        // card type (master, visa, amex)
	Number     string `json:"number"`      // card number
	Cvv        string `json:"cvv"`         // card verification code
	Expiration string `json:"exp"`         // the expiration year + month
}

// Create a Fake Card Struct
func BuildCard() (*Card, error) {
	creditCard := gofakeit.CreditCard()

	card := Card{
		HolderName: gofakeit.Name(),
		Type:       creditCard.Type,
		Number:     creditCard.Number,
		Cvv:        creditCard.Cvv,
		Expiration: creditCard.Exp,
	}

	return &card, nil
}

// Endpoint is responsible for responding to a false card generation
func CardGeneratorEndpoint(w http.ResponseWriter, r *http.Request) {
	card, err := BuildCard()

	if err != nil {
		w.WriteHeader(http.StatusInternalServerError)
		fmt.Fprint(w, "Sorry, something wrong happened!")
		return
	}

	w.Header().Set("Content-Type", "application/json")
	json.NewEncoder(w).Encode(card)
}
- web/health.go
package web

import (
	"fmt"
	"net/http"
)

// Endpoint is responsible for responding to application health
func HealthCheckEndpoint(w http.ResponseWriter, r *http.Request) {
	fmt.Fprint(w, "I'm so healthy 😌!")
}
O propósito do artigo não é detalhar cada aspecto da implementação, mas sim examinar os comentários inseridos no código que serão traduzidos para a documentação HTML.
Vamos executar a aplicação super hacker 💀 que gera informações de cartões 💳.
make dev

# ou

go run main.go
A aplicação estará acessível na porta 4000, é possível executar os comandos a seguir para verificar suas rotas:
curl http://localhost:4000/health

# I'm so healthy 😌!

curl http://localhost:4000/cards

# {"holder_name":"Ephraim Hand","type":"American Express" "number":"6062825121549507","cvv":"857","exp":"08/25"}
Gerar documentação
Com a estrutura do projeto pronta, executaremos o godoc para verificar a documentação gerada.
make docs-godoc

# ou

godoc -http=:4444
A documentação está acessível na porta 4444.
Bom, como vocês podem ver no vídeo acima, a navegação não ficou tão objetiva como gostaríamos, certo?
Assim, se um pacote não atende aos gostos populares, essa nova geração cria um novo, correto (vide NPM packages)? O pkgsite possui uma documentação mais estruturada, com uma melhor experiência de navegação do que a do godoc, utilizada como frontend dos pacotes Go. Encontrei uma referências que indica um movimento de "deprecated" do godoc em favor do uso do pkgsite.
Sem mais delongas! Vamos agora ao pkgsite, nada precisa ser ajustado somente instalar e executar o pacote.
É hora de visualizar uma documentação com uma melhor experiência de navegação.
make docs-pkgsite

# ou

pkgsite -http=:4444
A documentação está acessível na porta 4444.
Como podemos perceber, a diferença começa nas cores do tema. Muitas pessoas amam o dark-mode, confesso que gosto de algumas aplicações no light, não me julgem. A leitura do código no modo (raw) facilita o nosso copy/paste 😜. Fato o pkgsite tem uma experiência de navegação superior.
Repositório
A implementação está disponível em meu repositório do Github:
williampsenaFim!
Por hoje é só, espero que o conteúdo possa aprimoar suas experiências em Go, mantenham o 🧠 kernel atualizado, com tudo que seja respeitável, justo, puro e de boa fama, se há alguma virtude ou louvor que isso habite em nossos pensamentos! 🕊️ Filipenses 4:8
Referências
]]>Today I'm going to show you how to use Traefik locally with Podman, my favorite Edge Router, to publish services with route matching, authentication, and other middlewares in an outstanding way.
Requirements
We require Podman to run containers locally; if you want an introduction, I wrote the following articles:


Kubernetes lover ❤️?
Take a look after this post if you want to use Kubernetes ☸️ instead of Podman.

Podman SystemD Socket
Start the Podman systemd socket, as Traefik requires it to handle containers:
systemctl --user start podman.socketIf you prefer, you can set it to start immediately on boot:
systemctl --user enable podman.socketWhat is Traefik?
Traefik is a modern HTTP reverse proxy and load balancer developed in Go that is suited for microservice architecture. It is commonly used in containerized environments, such as Docker and Kubernetes.
There are no official Podman docs on how to make things work with Podman, although a few months ago I saw some examples using Podman Socket, similar to how Traefik works with Docker.
Traefik dynamically detects services as they are introduced to the infrastructure and routes traffic to them, making applications easier to manage and grow.
Major features:
- Automatic Service Discovery: Traefik can detect new services as they are introduced to your infrastructure, removing the need for human configuration.
- Dynamic Configuration: It can reorganize itself as services scale up or down, making it ideal for dynamic contexts like as container orchestration platforms.
- Load Balancing: Traefik includes built-in load balancing capabilities for distributing incoming traffic over many instances of a service.
- Automatic TLS: It may supply TLS certificates from Let's Encrypt, enabling HTTPS by default without requiring manual configuration.
- Dashboard: Traefik includes a web dashboard and a RESTful API, which enable operators to monitor and manage traffic routing and configuration.
- Middleware Support: It supports a number of middleware plugins for features like authentication, rate limiting, and request rewriting.
- Multiple Backends: Traefik can route traffic to multiple backend services based on various criteria like path, headers, or domain names.
Goals
The purpose is creating an example of using Podman Kube, a Kubernetes Deployment style to run pods. Traefik has a defined deployment schema. This article will introduce a way for annotating containers with labels.
Traefik communicates directly with Docker or Podman socket to listen for container creations and define routes and middlewares for them.
Please show the code that is working!

Deployments
- traefik.yaml
This file demonstrates a Traefik pod deployment that listens on ports 8000 and 8001.
apiVersion: v1
kind: Pod
metadata:
  name: traefik
  labels:
    app: traefik
spec:
  containers:
  - name: traefik
    image: docker.io/library/traefik:v3.0
    args:
    - '--accesslog=true'
    - '--api.dashboard=true'
    - '--api.insecure=true'
    - '--entrypoints.http.address=:8000'
    - '--log.level=info'
    - '--providers.docker=true'
    volumeMounts:
    - mountPath: /var/run/docker.sock:z
      name: docker_sock
    ports:
    - containerPort: 8000
      hostPort: 8000
      protocol: TCP
    - containerPort: 8080
      hostPort: 8001
      protocol: TCP
  restartPolicy: Never
  dnsPolicy: Default
  volumes:
  - name: docker_sock
    hostPath:
      path: "/run/user/1000/podman/podman.sock"
      type: File
Please check the location of your podman.sock, the default user is 1000, and the sock is typically found in /run/user/1000/podman/podman.sock.
- whoami.yaml
This file shows a replica of a simple HTTP container that returns container-specific information such as IP and host name for debugging.
Traefik uses container labels or annotations to define rules.
- traefik.http.routers.whoami.rule: specifies match rules for reaching the container, which can be host, header, path, or a combination of these.
- traefik.http.services.whoami.loadbalancer.server.port: specifies the port on which the container is listening.
apiVersion: v1
kind: Pod
metadata:
  name: whoami
  labels:
    traefik.http.routers.whoami.rule: Host(`whoami.localhost`)
    traefik.http.services.whoami.loadbalancer.server.port: 3000
spec:
  containers:
  - name: whoami
    image: docker.io/traefik/whoami:latest
    ports:
    - containerPort: 3000
      protocol: TCP
    env:
    - name: WHOAMI_PORT_NUMBER
      value: 3000
  restartPolicy: Never
  dnsPolicy: Default
🫠Unfortunately, replicas are not supported. If we had replicas, Traefik would handle them using round-robin to reach each container, as Traefik works with Docker Swarm and Kubernetes.
- whoami-secure.yaml
This file describes the same service but includes the Basic Auth middleware to demonstrate how to utilize middlewares.
- traefik.http.routers.{route-name}.middlewares: specifies the middlewares utilized in the current container.
- traefik.http.middlewares.{middleware-name}.basicauth.users: specifies the user and passwords.
You can generate htpassword with the following command:
docker run --rm -ti xmartlabs/htpasswd <username> <password> > htpasswd
apiVersion: v1
kind: Pod
metadata:
  name: whoami-secure
  labels:
    traefik.http.routers.whoami-secure.rule: Host(`whoami-secure.localhost`)
    traefik.http.services.whoami-secure.loadbalancer.server.port: 3000
    traefik.http.routers.whoami-secure.middlewares: auth
    traefik.http.middlewares.auth.basicauth.users: foo:$2y$05$.y24r9IFaJiODuv41ool7uLyYdc4H4pDZ5dSKkL.Z/tUg3K3NancS
spec:
  containers:
  - name: whoami-secure
    image: docker.io/traefik/whoami:latest
    ports:
    - containerPort: 3000
      protocol: TCP
    env:
    - name: WHOAMI_PORT_NUMBER
      value: 3000
  restartPolicy: Never
  dnsPolicy: Default
It is critical to note that only Traefik exposes a port to hosting; Traefik centralizes all traffic, proxying each request dealing with IP and listening port from each container.
Running
podman play kube pods/traefik/traefik.yaml
podman play kube pods/traefik/whoami.yaml
podman play kube pods/traefik/whoami-secure.yaml
Testing
You can view Traefik Dashboard at port 8001, which displays importing information about Routes and Containers.
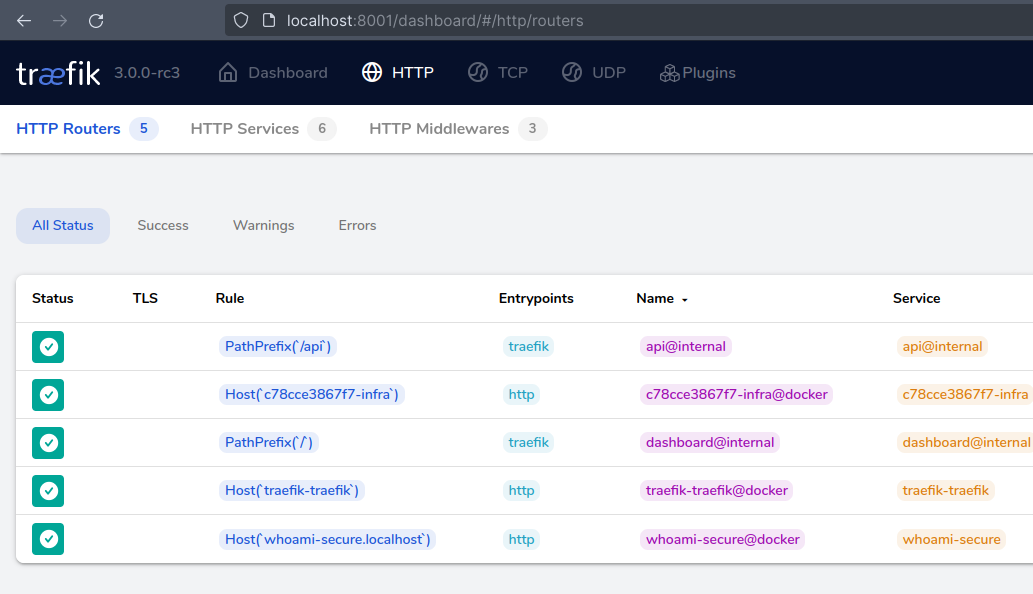
Let we test the Whoami route at endpoint http://whoami.localhost:8000/:
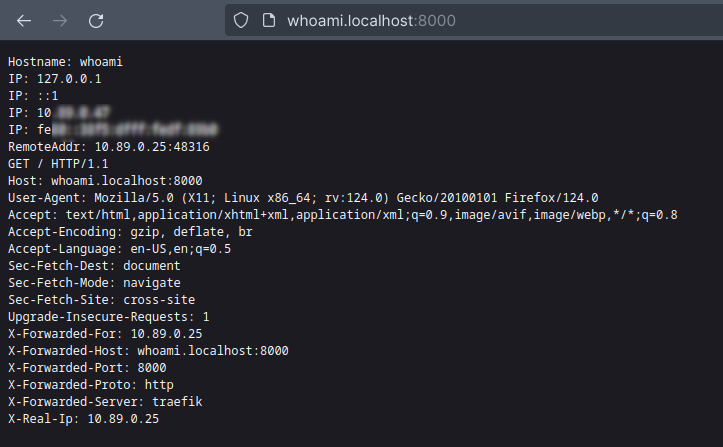
We can now check the Whoami route using basic authentication with the username "foo" and password "bar" at http://whoami-secure.localhost:8000/
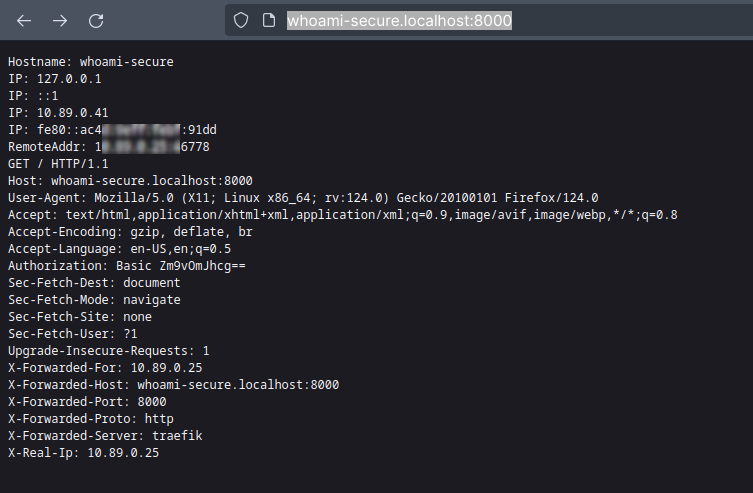
Troubleshooting
If hosts is not resolving you may need to add to /etc/hosts.
127.0.0.1 localhost whoami.localhost whoami-secure.localhost
Code
💡 Feel free to clone this repository, which contains related files:
williampsenaTearing down
podman play kube --down pods/traefik/traefik.yaml
podman play kube --down pods/traefik/whoami.yaml
podman play kube --down pods/traefik/whoami-secure.yaml
That's it
In this post, we will demonstrate how Traefik works, how to build settings to reach containers, and how to use middleware to use the full capability of container orchestration. I recommend that you look into Traefik middlewares; they can be more beneficial than an API Gateway at times.
Please keep your kernel 🧠 updated God bless 🕊️ you. I'll share a quote:
Whatever you do, work at it with all your heart, as working for the Lord, not for human masters. Colossians 3:23
References
]]>In this article, I'll show you how to deploy the lambda that we constructed in the previous section. This time, we need to set up AWS in preparation for deployment.
If you missed Part 1, please read it first.

No costs!
To test deployments, there is no cost; Amazon has a free tier for lambdas, so you can deploy as many lambdas as you want; you will pay once you exceed the following limits:
- 1 million free requests per month
- 3.2 million seconds of compute time per month
⚡ So be careful to write any lambdas that involve image or video processing, or that run for a long duration of time, because you'll most likely pay for it, and keep in mind that there is a 900-second execution limit (15 minutes).

Requirements
- Please create your AWS account to test deployment.
AWS Access Key
After you've created your account, you'll need to create a user and set your AWS_ACCESS_KEY_ID, AWS_SECRET_ACCESS_KEYPerhaps you are receiving a privilege-related problem; check to see if you have missed any policies for your user., and AWS_DEFAULT_REGION environment variables.
You can set these values in your profile (.bashrc, .zshrc, .profile, or bash_profile).
export AWS_ACCESS_KEY_ID="YOUR_ACCESS_KEY_ID"
export AWS_SECRET_ACCESS_KEY="YOUR_ACCESS_KEY"
export AWS_DEFAULT_REGION="YOUR DEFAULT REGION or us-east-1"
Group and privileges
Now we need to assign some privileges to your user, who will be in charge of deploying AWS Lambda through Serverless, Create a group, attach it to your created user, and provide the following permissions:
- AmazonAPIGatewayAdministrator
- AWSCloudFormationFullAccess
- AWSCodeDeployFullAccess
- AWSCodeDeployRoleForLambda
- AWSLambdaBasicExecutionRole
- AWSLambdaFullAccess
Role for AWS Lambda execution
If you did not specify an iam/role before deployment, Serverless will manage a user for you if the user has permission to create roles. In this example, I tried not to use this magic; in my opinion, allowing a tool to set your lambda permissions is not a good idea...

Then let's create some roles; we can ask Amazon help to create a Lambda-specific user, as I did below:
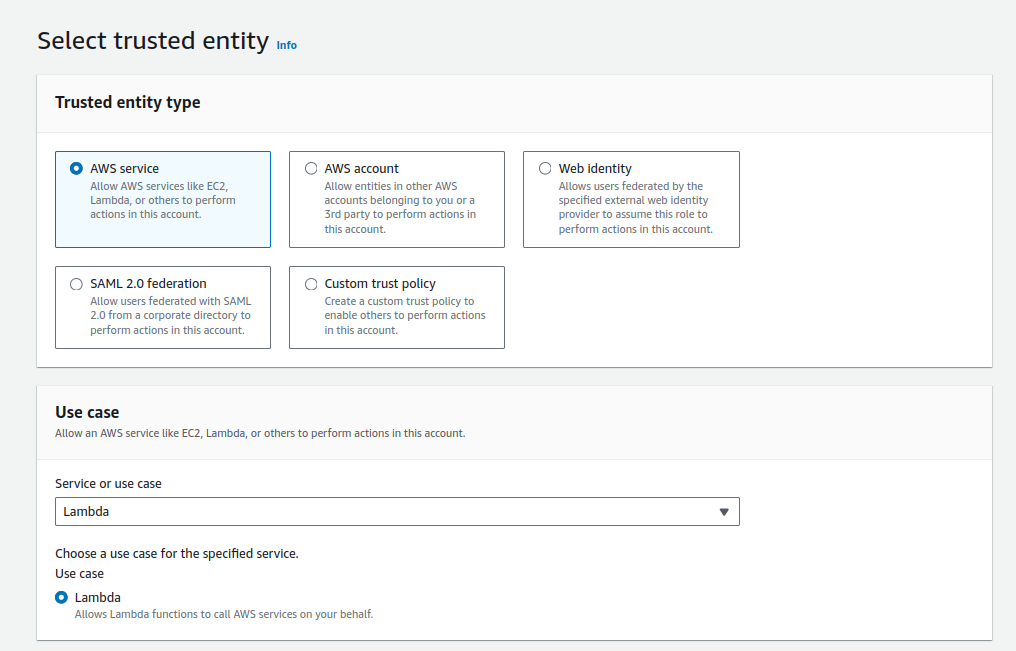
After we create this role, you must copy the ARN and specify it at deployment.
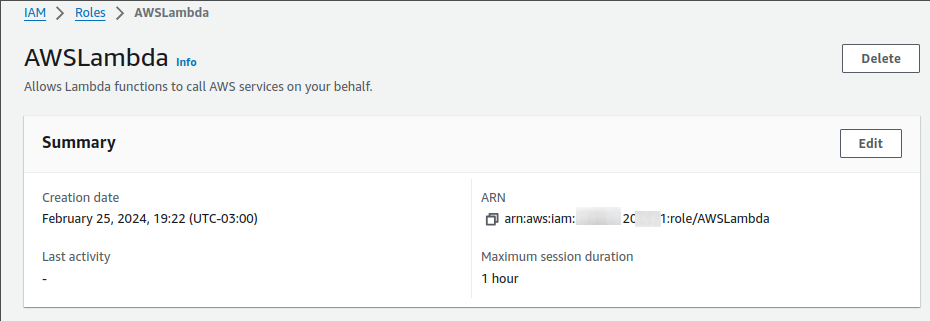
This is fantastic, however we construct a Lambda user who has access to any AWS resource, thus it's an excellent security question for production scenarios. I recommend that you create something specifically for your lambda. It's hard but safe.
service: service-currencies
frameworkVersion: "3"

provider:
  name: aws
  runtime: nodejs18.x
  iam:
    role: arn:aws:iam::12345678:role/AWSLambda

functions:
  api:
    handler: handler.listCurrencies
    events:
      - httpApi:
          path: /
          method: get
plugins:
  - serverless-plugin-typescript
  - serverless-offline

package:
  patterns:
    - '!node_modules/**'
    - 'node_modules/node-fetch/**'
The latest lines in the file refer to skipping node_modules during package deployment.
Deploy
If everything is set up correctly, the deployment will be successful. As an ordinary Friday deployment. 😜
SLS_DEBUG=* sls deploy --verbose
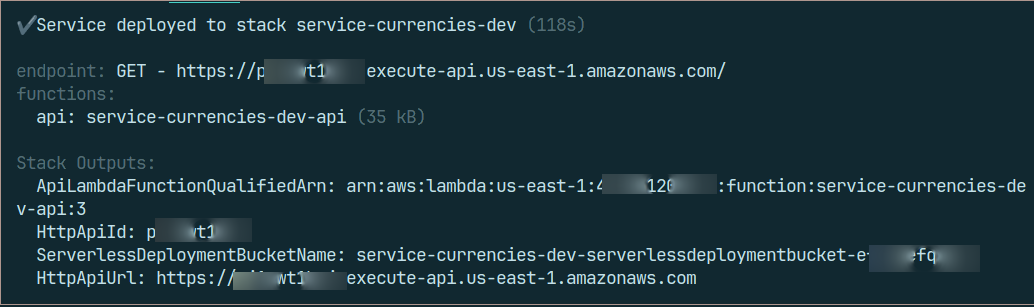
That's it; your public service has been deployed, and you may test the ApiUrl exposed after deployment.
Issues
- Perhaps you are receiving a privilege-related problem; check to see if you have missed any policies for your user.
- Remember to configure your AWS keys in your profile or via a shell session if you want.
Removing
To avoid spending money 💸 on a public test route, use the following command to remove your lambda function.
SLS_DEBUG=* sls remove
That's all
Thank you for your attention, I hope that my piece has helped you understand something about Lambda and has encouraged you to learn more about not only AWS but also Cloud.
Please keep your kernel 🧠 updated. God gives us blessings 🕊️.
References
]]>Today I'll teach you how to create an AWS Lambda using a Serverless framework, as well as how to structure and manage your functions as projects in your repository. Serverless provides an interface for AWS settings that you may configure in your deployment configurations and function permissions for any service, including S3, SNS, SQS, Kinesis, DynamoDB, Secret Manager, and others.
AWS Lambda
Is a serverless computing solution offered by Amazon Web Services. It lets you run code without having to provision or manage servers. With Lambda, you can upload your code as functions, and AWS will install, scale, and manage the infrastructure required to perform those functions.
AWS Lambda supports a variety of programming languages, including:
- Node.js
- Python
- Java
- Go
- Ruby
- Rust
- .NET
- PowerShell
- Custom Runtime, such as Docker container
First things first

First, you should set up your Node.js environment; I recommend using nvm for this.
The serverless CLI must now be installed as a global npm package.
# (npm) install serverless as global package
npm install -g serverless

# (yarn)
yarn global add serverless
Generating the project structure
Following command will create a Node.js AWS lambda template.
serverless create --template aws-nodejs --path hello-world
Serverless Offline and Typescript support
Let's add some packages to the project.
npm install -D serverless-plugin-typescript typescript serverless-offline

# yarn

yarn add -D serverless-plugin-typescript typescript serverless-offline

# pnpm

pnpm install -D serverless-plugin-typescript typescript serverless-offline
Show the code

If you prefer, you can clone the repository.
- hello_world/selector.ts
This file includes the function that converts external data to API contracts.
import { CurrencyResponse } from './crawler'

export type Currency = {
  name: string
  code: string
  bid: number
  ask: number
}

export const selectCurrencies = (response: CurrencyResponse) =>
  Object.values(response).map(
    currency =>
      ({
        name: currency.name,
        code: currency.code,
        bid: parseFloat(currency.bid),
        ask: parseFloat(currency.ask),
      } as Currency)
  )

export default {
  selectCurrencies,
}
- hello_world/crawler.ts
This file contains the main function, which retrieves data from a JSON API using currency values.
export type CurrencySourceData = {
  code: string
  codein: string
  name: string
  high: string
  low: string
  varBid: string
  pctChange: string
  bid: string
  ask: string
  timestamp: string
  create_date: string
}

export type CurrencyResponse = Record<string, CurrencySourceData>

export const apiUrl = 'https://economia.awesomeapi.com.br'

export async function getCurrencies(currency) {
  const response = await fetch(`${apiUrl}/last/${currency}`)

  if (response.status != 200)
    throw Error('Error while trying to get currencies from external API')

  return (await response.json()) as CurrencyResponse
}

export default {
  apiUrl,
  getCurrencies,
}
- hello_world/handler.ts
Now we have a file containing a function that acts as an entrypoint for AWS Lambda.
import { getCurrencies } from './crawler'
import { selectCurrencies } from './selector'
import { APIGatewayProxyEvent, APIGatewayProxyResult } from 'aws-lambda'

const DEFAULT_CURRENCY = 'USD-BRL,EUR-BRL,BTC-BRL' as const

export async function listCurrencies(
  event: APIGatewayProxyEvent
): Promise {
  try {
    const currency = event.queryStringParameters?.currency || DEFAULT_CURRENCY
    const currencies = selectCurrencies(await getCurrencies(currency))

    return {
      statusCode: 200,
      body: JSON.stringify(currencies, null, 2),
    }
  } catch (e) {
    console.error(e.toString())

    return {
      statusCode: 500,
      body: '🫡 Something bad happened',
    }
  }
}

export default {
  listCurrencies,
}
💡The highlight lines indicate that if we had more than one function on the same project, we could wrap promises to centralize error handling.
- hello_world/serverless.yml
This file explains how this set of code will run on AWS servers.
service: service-currencies
frameworkVersion: "3"

provider:
  name: aws
  runtime: nodejs18.x

functions:
  api:
    handler: handler.listCurrencies
    events:
      - httpApi:
          path: /
          method: get
plugins:
  - serverless-plugin-typescript
  - serverless-offline
- hello_world/tsconfig.json
The Typescript settings.
{
  "compilerOptions": {
    "preserveConstEnums": true,
    "strictNullChecks": true,
    "sourceMap": true,
    "allowJs": true,
    "target": "es5",
    "outDir": "dist",
    "moduleResolution": "node",
    "lib": ["es2015"],
    "rootDir": "./"
  }
}
Execution
Let's test the serverless execution with following command:
SLS_DEBUG=* serverless offline

# or

SLS_DEBUG=* sls offline
You can look at the API response at http://localhost:3000.
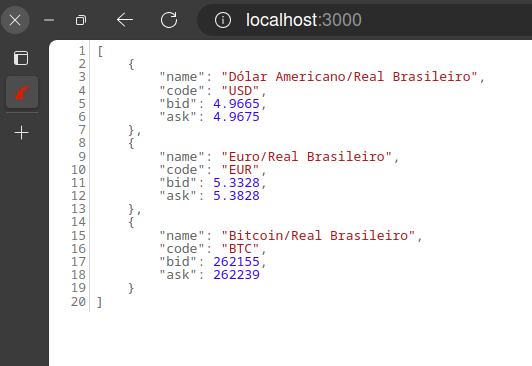
We can run lambda locally without the Serverless offline plugin and get the result in the shell:
sls invoke local -f api
Tests
I use Jest to improve test coverage and illustrate how to use this wonderful approach, which is often discussed but not frequently utilized but should be 😏. I'm not here to claim full coverage, but some coverage is required.
- hello_world/__tests__ /handler.spec.ts
import {
  APIGatewayProxyEvent,
  APIGatewayProxyEventQueryStringParameters,
} from 'aws-lambda'
import { listCurrencies } from '../handler'
import fetchMock = require('fetch-mock')
import { getFixture } from './support/fixtures'

describe('given listen currencies http request', function () {
  beforeEach(() => fetchMock.restore())

  it('should raise error when Currency param is empty', async function () {
    fetchMock.mock(/\/last\//, { status: 404, body: '' })

    const event = { queryStringParameters: {} } as APIGatewayProxyEvent

    const result = await listCurrencies(event)

    expect(result).toEqual({
      body: '🫡 Something bad happened',
      statusCode: 500,
    })
  })

  it('should return currency list', async function () {
    fetchMock.mock(/\/last\//, {
      status: 200,
      body: getFixture('list_currencies_ok.json'),
    })

    const event = {
      queryStringParameters: {
        currency: 'USD-BRL,EUR-BRL,BTC-BRL',
      } as APIGatewayProxyEventQueryStringParameters,
    } as APIGatewayProxyEvent

    const result = await listCurrencies(event)
    expect(result.statusCode).toBe(200)
    expect(JSON.parse(result.body)).toEqual([])
  })
})
A lot of code will be required to run tests; take a look at the repository and then type:
npm testExtra pipeline
Pipeline GitHub actions with tests, linter (eslint) and checker:
name: build

on:
  push:
    branches: [main]
  pull_request:
    branches: [main]

jobs:
  build:
    runs-on: ubuntu-latest
    defaults:
      run:
        working-directory: 'hello-world'

    steps:
      - uses: actions/checkout@v3
      - uses: pnpm/action-setup@v3
        with:
          version: 8
      - name: Use Node.js ${{ matrix.node-version }}
        uses: actions/setup-node@v3
        with:
          node-version: '18.x'
          cache: 'pnpm'
          cache-dependency-path: ./hello-world/pnpm-lock.yaml

      - name: Install dependencies
        run: pnpm install

      - name: Run ci
        run: npm run test && npm run lint && npm run check
Final Thoughts
In this post, we discussed how to setup our serverless function in the development context, execute and test it before moving it to the production environment, as it should be. So that covers up the first phase; I'll publish a second blog describing how to move our local function into production and deploy it in an AWS environment.
Thank you for your time, and please keep your kernel 🧠 updated to the most recent version. God brings us blessings 🕊️.
Part 2...

Há alguns anos, troquei o conforto da linguagem (C#) e o contexto (Microsoft) com os quais trabalhei por longos anos por um desafio Rails, Elixir e outras linguagens.
Eu estava em busca dessa virada na carreira para agregar outros sabores à minha experiência. Admito que este desafio otimizou a minha forma de pensar e como utilizar as tecnologias disponíveis. Como um usuário Linux de longa data e também um programador de linguagens variadas como C#, Node.js, Java, Python e Rails, eu necessitava desta mudança. Eu passava ao menos 8 horas por dia no Windows trabalhando focado no Visual Studio e um pouco no SQL Server, o que não é ruim, mas na minha opinião eu precisava dessa generalização além da experiência comprovada no meu dia a dia.
Mesmo eu desenvolvendo projetos pessoais com diferentes tecnologias, eu ainda sentia falta dessa experiência diária, de trocar figurinhas e melhorar a cada dia. As inovações de hoje acontecem em uma frequência diferenciada, e não datadas como de costume.
Para se ter uma ideia, atualizações das linguagens de back-end eram de 1 a 3 anos, no front-end, houve demora dos navegadores para implementar a cobertura do ECMAScript 2015 (ES6), havia poucos bancos diferentes, resumidamente esse era a frequência de atualização...
Para você...
Se você sente essa vontade de descobrir algo fora do seu contexto, este artigo é para você que já trabalhou muito com linguagens orientadas à objetos e quer entender um pouco sobre a linguagem funcional Elixir, e por onde começar...
Essa linguagem melhorou a maneira como eu programo. Eu era daqueles programadores que aplicava paradigmas e padrões até no Hello World, sabe? Porque no livro Guru, alguém disse que esta é a única maneira de resolver este problema. Em suma, havia uma certa falta de maturidade.

Minha primeira impressão do Elixir foi incrível, módulos, funções, funções puras, sem efeitos ou surpresas, e também não puras que acessam arquivos, bancos de dados ou serviços.
O que quero ressaltar é que minha primeira exposição ao Elixir foi bem diferente, pois nunca havia trabalhado com linguagens funcionais como Haskell, Erlang, OCaml, Scala, F# e Clojure, apenas tinha visto ou ouvido falar sobre isso 😆.
É claro que para quem já trabalhou com alguma dessas linguagens, que possuem muitos conceitos e princípios a exposição e opinião podem ser diferentes, devemos aplaudir os esforços do Elixir em fornecer uma ampla gama de recursos de linguagem.
A estrutura da linguagem ajuda a manter o código limpo e elegante, além de todos os recursos poderosos do BEAM (Erlang VM), ele suporta o desenvolvimento de grandes aplicações, um exemplo de aplicação em Erlang é nosso querido RabbitMQ muito conhecido por nós desenvolvedores e outro case conhecido por todos nós é o WhatsApp.
Abaixo há uma lista de cases do Elixir:
- Discord
- Heroku
- Pepsico
O que é Elixir?
É uma linguagem de programação funcional de uso geral que roda na Máquina Virtual Erlang (BEAM). Compilando sobre o Erlang, o Elixir fornece aplicativos distribuídos e tolerantes a falhas, que utilizam os recursos de CPU e memória de forma otimizada. Também fornece recursos de meta programação como macros e polimorfismo por protocolos.
Um ponto importante a linguagem foi criada pelo brasileiro 🇧🇷 José Valim.
Elixir tem semelhança sintática ao Ruby e também aproveita recursos como o popular doctest e List Comprehension do Python. Podemos dizer que inspirações trouxeram as melhores práticas de programação para a linguagem.
A linguagem possui tipagem dinâmica, o que significa que todos os tipos são verificados em tempo de execução, assim como o Ruby e JavaScript.
Podemos "tipar" algumas coisas usando Typespecs e Dialyzer para validação de inconsistências, porém isso não interfere na compilação...
Instalando o Elixir
O Elixir possui gerenciador de versões chamado Kiex, mas para rodar o Elixir precisamos de uma máquina virtual Erlang gerenciada pelo Kerl. Muitos instaladores não são uma boa maneira de começar, ok?
Eu recomendo usar o ASDF que tem dois plugins para Elixir e Erlang, e também suporta o arquivo .tools-version onde você especifica qual versão da máquina virtual Erlang sua aplicação está usando (OTP) e qual versão do Elixir.
Escrevi um artigo sobre ASDF + Elixir, então recomendo que você instale a partir deste artigo:
Read Eval Print Loop (REPL)
O melhor lugar para conhecer, aprender e testar uma linguagem é o REPL. Iremos agora testar os conceitos da linguagem antes de adicionar de qualquer tipo de protótipo do projeto.
Tipos de dados
Abaixo temos os tipos de dados existentes no Elixir.
# Inteiros
numero = 1
# Pontos flutuantes
flutuante = 3.14159265358979323846

# Booleanos
verdadeiro = true
falso = false

# Átomos
atom = :sou_atom

# Strings
string = "texto"

# Map
map = %{ "name" => "Foo", "action" => "bar" }
map_atom = %{ name: "Foo", action: :bar }
[map["action"], map_atom.action]
# ["bar", :bar]

# Keyword list
keyword_list = [name: "Bar", action: :foo]
action = keyword_list[:action]

# Lista
list = [1, 2, 3]
Valores Imutáveis
Imutabilidade é recurso também presente em linguagens orientadas como (C# e Java), no Elixir é um recurso é nativo. A programação funcional estabelece que variáveis não podem ser modificadas após sua inicialização, com o simples propósito de evitar efeitos que afetem o resultado, resumidamente fn (1+1) = 2.
Se ocorrer uma nova atribuição de valor, uma nova variável será criada. Resumindo não temos referência para essa variável, vou dar um exemplo de referência usando JavaScript e como seria no Elixir.
No JavaScript...
var messages = ["hello"]

function pushMessageWithEffect(list, message) {
    list.push(message)

    return list
}

function pushMessage(list, message) {
    return list.concat(message)
}

const nextMessage = pushMessage(messages, "world")
console.log(messages, nextMessage)
// [ 'hello' ] [ 'hello', 'world' ]

const nextMessage2 = pushMessageWithEffect(messages, "galaxy")
console.log(messages, nextMessage2)
// [ 'hello', 'galaxy' ] [ 'hello', 'galaxy' ]
No Elixir...
defmodule Messages do
    def push_message(list, message) do
        list ++ [message]
    end
end

messages = ["hello"]
next_message = Messages.push_message(messages, "world")
{ messages, next_message }
# {["hello"], ["hello", "world"]}
No Elixir temos que lidar com módulos e funções, não existem classes então valores não herdam comportamento, como por exemplo em Java cada Objeto recebe um toString() que pode ser sobrescrito para traduzir uma classe em um String, assim como no C# Object.ToString().
Desta forma seria impossível pegar a lista e chamar uma método que a modifique, precisamos gerar uma nova lista para operações em lista e mapas o Elixir possui um módulo Enum que possui muitas implementações como Map, Reduce, filtros, concatenação e outros recursos.
Funções
As funções são responsáveis pelos comportamentos que definem um programa. Essas podem ser puras ou impuras.
Pure Functions (puras)
- Trabalha com valores imutáveis;
- O resultado da função é definido com base nos seus argumentos explícitos, nada de magias 🧙♂️;
- A execução desta função não tem efeito colateral;
Impure Functions (impuras)
Funções impuras podemos definir como complexas, estas podem depender de recursos externos ou executar processos que impactam diretamente no seu resultado, como os exemplos abaixo:
- Escrita em arquivos ou banco de dados;
- Publicação de mensagem em filas;
- Requisições HTTP;
Esses tipos de recursos externos, além de não garantirem que a resposta seja a mesma, também podem apresentar instabilidade, causando erros, algo que uma função pode não esperar, sendo assim um efeito colateral ou "impureza".
Certa vez ouvi em uma apresentação em F# que em C# é comum que nossos métodos (funções) sejam impuros, podendo retornar um resultado do tipo esperado ou simplesmente interromper o fluxo lançando uma exceção. Faz todo o sentido houve um direcionamento dos frameworks, onde começamos a criar exceções relacionadas ao negócio, sendo assim, passamos a usar exceções como desvios de bloco de código, ou seja, o GOTO da estruturada na orientação à objetos 🤦.
Abaixo temos um exemplo prático de uma função de soma pura e soma global que utiliza o módulo Agent para manter o estado o que causará o efeito.
defmodule Functions do
  use Agent

  def start_link(initial_value) do
    Agent.start_link(fn -> initial_value end, name: __MODULE__)
  end

  def state do
    Agent.get(__MODULE__, & &1)
  end

  def update_state(value) do
    Agent.update(__MODULE__, &(&1 + value))
  end

  def sum(x, y) do
    x + y
  end

  def global_sum(x, y) do
    update_state(x + y)
    state()
  end
end

Functions.start_link(0)
# Inicia processo para manter o estado com valor inicial 0

Functions.sum(1, 1)
# 2

Functions.sum(1, 1)
# 2

Functions.global_sum(1, 1)
# 2

Functions.global_sum(2, 3)
# 7
O uso do módulo Agent facilita na clareza de que o método em questão tem efeitos colaterais.
Concorrência, Processos e Tolerância a falhas
Como já foi dito o Elixir lida com processos de forma bem otimizada visando CPU cores, graças também a execução na máquina virtual do Erlang (BEAM).
O Elixir possui uma implementação de processo em segundo plano chamada GenServer/GenStage. Suponha que você queira criar um processo que receba estímulo de uma fila ou um processo agendado que envie uma solicitação HTTP.
Você pode dimensionar o processo para executar (N) GenServer/GenStage, além disso, existe um Supervisor, que é um processo especial que tem uma finalidade de monitorar outros processos.
Esses supervisores permitem criar aplicativos tolerantes a falhas, reiniciando automaticamente processos filhos quando eles falham.
Este tema pode ser considerado o principal do Elixir.
Abaixo está um trecho de código para configurar o supervisor da aplicação de um dos meus projetos em desenvolvimento o BugsChannel.
def start(_type, _args) do
    children =
      [
        {BugsChannel.Cache, []},
        {Bandit, plug: BugsChannel.Api.Router, port: server_port()}
      ] ++
        Applications.Settings.start(database_mode()) ++
        Applications.Sentry.start() ++
        Applications.Gnat.start() ++
        Applications.Channels.start() ++
        Applications.Mongo.start(database_mode()) ++
        Applications.Redis.start(event_target())

    opts = [strategy: :one_for_one, name: BugsChannel.Supervisor]

    Logger.info("🐛 Starting application...")

    Supervisor.start_link(children, opts)
end
Neste caso o supervisor é responsável por vários processos, como filas, bancos de dados e outros processos.
Macros
Há uma afirmação clara na documentação do Elixir sobre macros "As macros só devem ser usadas como último recurso. Lembre-se que explícito é melhor do que implícito. Código claro é melhor do que código conciso." ❤️
Macros podem ser consideradas mágicas 🎩, assim como no RPG, toda magia tem um preço 🎲. Usamos para compartilhar comportamentos, abaixo temos um exemplo básico do que podemos fazer, simulando herança, utilizando um módulo como classe base.
defmodule Publisher do
  defmacro __using__(_opts) do
    quote do
      def send(queue, message) do
        :queue.in(message, queue)
      end

      defoverridable send: 2
    end
  end
end

defmodule Greeter do
  use Publisher

  def send(queue, name) do
    super(queue, "Hello #{name}")
  end
end

queue = :queue.from_list([])

queue = Greeter.send(queue, "world")

:queue.to_list(queue)
# ["Hello world"]
O módulo Publisher define uma função chamada send/2. Esta função é reescrita pelo módulo Greeter para adicionar padrões às mensagens, semelhante às substituições de métodos de classe (overrides).
Para maior clareza, este exemplo podemos implementar sem herança, usando composição do módulo ou apenas o modulo diretamente. Por esta razão, as macros devem ser sempre avaliadas como último recurso.
defmodule Publisher do
  def send(queue, message) do
    :queue.in(message, queue)
  end
end

defmodule Greeter do
  def send(queue, name) do
    Publisher.send(queue, "Hello #{name}")
  end
end

queue = :queue.from_list([])

queue = Greeter.send(queue, "world")

:queue.to_list(queue)
# ["Hello world"]
Além do use, existem outras diretivas definidas pelo Elixir para reuso de funções (alias, import, require), exemplos de uso:
defmodule Math.CrazyMath do
  def sum_pow(x, y), do: (x + y) + (x ** y)
end

defmodule AppAlias do
  alias Math.CrazyMath

  def calc(x, y) do
    "The sum pow is #{CrazyMath.sum_pow(x, y)}"
  end
end

defmodule AppImport do
  import Math.CrazyMath

  def calc(x, y) do
    "The sum pow is #{sum_pow(x, y)}"
  end
end

defmodule AppRequire do
  defmacro calc(x, y) do
    "The sum pow is #{Math.CrazyMath.sum_pow(x, y)}"
  end
end

AppAlias.calc(2, 2)
# "The sum pow is 8"

AppImport.calc(2, 2)
# "The sum pow is 8"

AppRequire.calc(2, 2)
# function AppRequire.calc/2 is undefined or private.
# However, there is a macro with the same name and arity.
# Be sure to require AppRequire if you intend to invoke this macro

require AppRequire
AppRequire.calc(2, 2)
# "The sum pow is 8"
Pattern Matching
A sobrecarga de métodos nas linguagens é relacionada ao número de argumentos e seus tipo de dados, que definem uma assinatura que auxiliam o código compilado a identificar qual método deve ser invocado, já que possuem o mesmo nome porém assinaturas diferentes.
No Elixir há Pattern Matching em todos os lugares, desde a sobrecarga de uma função as condições, esse comportamento da linguagem é sensacional, devemos prestar atenção à estrutura e comportamento.
defmodule Greeter do
  def send_message(%{ "message" => message }), do: do_message(message)

  def send_message(%{ message: message }), do: do_message(message)

  def send_message(message: message), do: do_message(message)

  def send_message(message) when is_binary(message), do: do_message(message)

  def send_message(message), do: "Invalid message #{inspect(message)}"

  def send_hello_message(message) when is_binary(message), do: do_message(message, "hello")

  def do_message(message, prefix \\ nil) do
    if is_nil(prefix),
      do: message,
      else: "#{prefix} #{message}"
  end
end

Greeter.send_message("hello world string")
# "hello world string"
Greeter.send_message(message: "hello keyword list")
# "hello keyword list"
Greeter.send_message(%{ "message" => "hello map", "args" => "ok" })
# "hello map"
Greeter.send_message(%{ message: "hello atom map", args: "ok" })
# "hello atom map"
Greeter.send_hello_message("with prefix")
"hello with prefix"

some_var = {:ok, "success"}
{:ok, message} = some_var
Condicional
Podemos criar condições com estruturas conhecidas como if e case, existe também cond que permite validar múltiplas condições de forma organizada e elegante.
defmodule Greeter do
  def say(:if, name, lang) do
    if lang == "pt" do
      "Olá #{name}"
    else
      if lang == "es" do
        "Hola #{name}"
      else
        if lang == "en" do
          "Hello #{name}"
        else
          "👋"
        end
      end
    end
  end

  def say(:cond, name, lang) do
    cond do
      lang == "pt" -> "Olá #{name}"
      lang == "es" -> "Hola #{name}"
      lang == "en" -> "Hello #{name}"
      true -> "👋"
    end
  end

  def say(:case, name, lang) do
    case lang do
      "pt" -> "Olá #{name}"
      "es" -> "Hola #{name}"
      "en" -> "Hello #{name}"
      _ -> "👋"
    end
  end
end

langs = ["pt", "en", "es", "xx"]

Enum.map(langs, fn lang -> Greeter.say(:if, "world", lang)  end)
# ["Olá world", "Hello world", "Hola world", "👋"]

Enum.map(langs, & Greeter.say(:case, "world", &1))
# ["Olá world", "Hello world", "Hola world", "👋"]

Enum.map(~w(pt en es xx), & Greeter.say(:cond, "world", &1))
# ["Olá world", "Hello world", "Hola world", "👋"]
Aqui estão algumas considerações da implementação para fornecer clareza adicional.
- Podemos perceber que o if não é vantajoso e causa o efeito hadouken, devido a falta do "else if", esse recurso não existe em Elixir e creio que seja proposital, pois temos outras formas de lidar com essas condições, usando case ou cond, ainda há a possibilidade usar guards no case;
- Sigils, presente no Ruby você também pode definir um array desta forma ~w(pt en es xx);
- & &1, forma simplificada de definir uma função anônima e o &1 refere-se a o primeiro argumento dela, neste caso a língua (pt, en, es ou xx);
Função, Função, Função
As estruturas de linguagem são funções e você pode obter o retorno delas da seguinte forma:
input = "123"

result = if is_nil(input), do: 0, else: Integer.parse(input)
# {123, ""}

result2 = if is_binary(result), do: Integer.parse(result)
# nil

result3 = case result do
  {number, _} -> number
  _ -> :error
end

result4 = cond do
  is_atom(result3) -> nil
  true -> :error
end
# :error
A sintaxe de if, case e cond são funções com açúcar sintático, diferentemente do Clojure onde if é uma função e fica bem claro que você está trabalhando com o resultado da função. Na minha opinião prefiro o açúcar sintático, neste caso ele facilita muito a leitura e elegância do código 👔.
Pipe Operator
Para facilitar a compreensão do código quando há um pipeline de execução de função, o pipeline pega o resultado à esquerda e passa para a direita. Incrível! Este recurso deveria existir em todas as linguagens de programação. Há uma proposta de implementação para JavaScript 🤩, quem sabe um dia teremos de forma nativa!
defmodule Math do
  def sum(x, y), do: x + y
  def subtract(x, y), do: x - y
  def multiply(x, y), do: x * y
  def div(x, y), do: x / y
end

x =
  1
  |> Math.sum(2)
  |> Math.subtract(1)
  |> Math.multiply(2)
  |> Math.div(4)

x
# (((1 + 2) -1) * 2) / 4)
# 1
Outros recursos
Concatenação strings
x = "hello"
y = "#{x} world"
z = x <> " world"
# "hello world"

x = nil
"valor de x=#{x}"
# "valor de x="
Guards
São recursos utilizados para melhorar a correspondência de padrões, seja em condições ou funções:
defmodule Blank do
    def blank?(""), do: true
    def blank?(nil), do: true
    def blank?(map) when map_size(map) == 0, do: true
    def blank?(list) when Kernel.length(list) == 0, do: true
    def blank?(_), do: false
end

Enum.map(["", nil, %{}, [], %{foo: :bar}], & Blank.blank?(&1))
# [true, true, true, true, false]

require Logger

case {:info, "log message"} do
  {state, message} when state in ~w(info ok)a -> Logger.info(message)
  {state, message} when state == :warn -> Logger.warning(message)
  {state, message} -> Logger.debug(message)
end

# [info] log message
Erlang
Podemos acessar os recursos Erlang diretamente do Elixir da seguinte forma:
queue = :queue.new()
queue = :queue.in("message", queue)

:queue.peek(queue)
# {:value, "message"}
O Erlang possui um modulo para criação de uma filas em memória (FIFO) o Queue.
Bibliotecas e suporte
Elixir foi lançado em 2012 e é uma linguagem mais recente em comparação com Go, lançado em 2009. Encontramos muitas bibliotecas no repositório de pacotes Hex. O interessante há compatibilidade com pacotes Erlang e existem adaptações de pacotes conhecidos do Erlang para o Elixir.
Um exemplo é Plug.Cowboy, que usa o servidor web Cowboy de Erlang via Plug in Elixir, uma biblioteca para construir aplicativos por meio de funções usando vários servidores web Erlang.
Vale ressaltar que o Erlang é uma linguagem sólida e está no mercado há muito tempo, desde 1986, e o que não existir no Elixir provavelmente encontraremos em Erlang.
Existem contribuições diretas do criador da linguagem o José Valim, de outras empresas e muito trabalho da própria comunidade.
Abaixo temos bibliotecas e frameworks conhecidos no Elixir:
- Phoenix, é um framework de desenvolvimento web escrito em Elixir que implementa o padrão MVC (Model View Controller) do lado do servidor.
- Ecto, ORM do Elixir, um kit de ferramentas para mapeamento de dados e consulta integrada.
- Jason, um analisador e gerador JSON extremamente rápido em Elixir puro.
- Absinthe, A implementação de GraphQL para Elixir.
- Broadway, crie pipelines simultâneos e de processamento de dados de vários estágios com o Elixir.
- Tesla, é um cliente HTTP baseado em Faraday (Ruby);
- Credo, ferramenta de análise de código estático para a linguagem Elixir com foco no ensino e consistência de código.
- Dialyxir, pacote de Mix Tasks para simplificar o uso do Dialyzer em projetos Elixir.
Finalizando...
O objetivo do artigo era preparar um café expresso ☕, porém acabei moendo alguns grãos para extrair o que achei de bom no Elixir, com a intenção de compartilhar e trazer os detalhes a mesa, para quem tem curiosidade e vontade de entender um pouco mais sobre a linguagem e os conceitos de linguagem funcional. Certamente alguns tópicos foram esquecidos, seria impossível falar de Elixir em apenas um artigo 🙃, fica como débito técnico...

Um forte abraço, Deus os abençoe 🕊️ e desejo a todos um Feliz Ano Novo.
Mantenham seu kernel 🧠 atualizado sempre.
Referências
]]>
When we think about legacy systems, we typically think of systems developed in languages like Cobol, Clipper, Pascal, Delphi, Visual Basic, connected to old databases such as Paradox, DB2 and, Firebird.
Nowadays, it's a little different in an organization with multiple languages and projects. For example, Paypal opted to go from Java to Node years ago, and Twitter switched from Ruby to Java. With these examples, we can see that in the legacy context, we are dealing with modern languages, such as Ruby and Java. However, I don't think these developers were driven to change because they favored one language over another.
Refactoring as the solution?
Refactoring is becoming more popular for a particular group of engineers who prefer the hype language over others. I'm not here to pass judgment because I'm wearing this cover 🧙🏾 at a specific point in my career. But I should emphasize that refactoring is never the easiest or best way to solve an issue. As a developer that works with a range of programming languages, You will never find a bulletproof language that works so well for frontend and backend or bff (backend for frontend), that is amazing for mobile, that is lovely and comprehensible for concurrency, that is conformable to test, and so on...
Stop thinking about frameworks and start thinking about how this language will work in your project and ask some questions; the learning curve is good for other members; and consider how other people will solve issues with your produced project. Because if you don't care, you're creating the next legacy system.
Let's get started on a list for creating a stunning legacy system.
1) Languages with limited library support
Before deciding a programming language, evaluate what you plan to develop as a project first, and then whether your stack will be supported by the programming language, for example:
I'd like to create a project involving machine learning or data science. Python, as you may know, is widely used for these reasons and has strong commercial and community support. We may be able to find additional Java or Node libraries, but you will almost certainly have to get your hands dirty translating library behaviors and providing some compatibility.
I'm not arguing that it's completely wrong to use language A or B; you can chose, but you should consider the advantages and downsides. And this decision is sound in the long run when your team chooses to move to another language since there is no support for building quickly, because nowadays you must release fast or your solution design may become deprecated.

2) Use a framework that updates slowly
Nowadays, languages support a wide range of databases, services, and integrations, but occasionally there is limited support, or the community does not generate active updates based on your requirements. That condition is common, for example: NPM, RubyGems and Hex packages without updates for months or years.
Some projects are mature and there is no requirement to update them so frequently, but there comes a specific point when the project is supported by three core committers, each of whom has their own priorities. So, in that case, you must work with these dependencies and collaborate on open-source projects to solve issues or improve security; so, before establishing a framework, list the dependencies as clearly as possible.
Therefore, if open-source efforts exceed commercial efforts, your team may switch from one framework or language to another, introducing legacy systems.

3) Don't think about concurrency or performance.
We commonly hear monolith first and keep it simple, which is a genuine and reliable technique for launching your MVP as soon as possible, but be careful to maintain things simple enough to level up when necessary. I'm not advocating putting reuse ahead of usage, but don't make things too dependent on a framework. Some abstractions with low utilization will allow you to upgrade when "concurrency" comes knocking at your door demand for more performance.

4) Avoid writing tests or maintaining adequate coverage.
Coverage tests are a sensitive topic; I've heard that quantity isn't necessarily better than quality, but less coverage is always worse. You should not write code that lacks appropriate coverage; instead, you should enumerate possible cases to provide coverage; that is every developer's duty. Assume you are a developer for an airline system; is less coverage acceptable? Okay, I took it seriously. But if we get a system with no testing and a bad design we should replace it as quickly as possible.

However, these systems will occasionally live a long time if they work properly and don't interfere with the strong performance of the stack, and the team has no plans to touch these poorly built systems. A system without testing is a good approach to start a legacy system, in my opinion.
5) Write in a new language in the same way you do in previous languages.
It is important to note that approaches and patterns can be used to any language, but you should be aware of the two paradigms commonly used when developing a project, the most well-known of which is Object-Oriented Programming (OOP), and another strong paradigm known as Functional Programming (FP). While OOP emphasizes class management and reusing behaviors, FP tackles modules, functions, and immutability, thus comparing different approaches. I propose using a well-known project's design as a guide when developing your project in a new language, because it's common and comprehensible to write code for a language and then have another person look at it and remark...

To summarize, writing code in a new language is challenging, especially when establishing a new project, but it is a worthwhile experience. If you did your homework and chose this challenge, try to develop small initiatives first; it's not time to rewrite all behaviors that you consider legacy.
Remember that your baby system could become legacy at the same rate that a npm package is released. 😆
6) Write code for yourself rather than for your team.
I believe this happens more frequently than it should. We should not think of of code as abstract art because abstract art is about feelings and is hard to comprehend. Don't let hype influence how you construct your application; the coding should be as straightforward as history.
When coding, try to use well-known and rock-solid methodologies such as SOLID. If you develop a project for yourself, someone will look at it months or years later and say it's too complex, and it's time to retire it and...

A new legacy was born. To replace the legacy system features, a new system will be released.
Final thoughts
In this article, I discuss things to think about while developing a new system with new behaviors or refactoring behaviors from an existing production system. Sometimes a new system is successful, as proved by metrics and team, but other times a redesign works well for a brief amount of time and a new design is required.
To recap, I am not arguing that we should not test hype languages or frameworks, but rather that when you want to bring these new techniques to your team, you should do your homework, ask questions, create proof of concept (PoC), and test metrics to avoid replacing one issue with another.
Thank you for investing your time in reading; God 🕊️ be with you and keep your kernel 🧠 updated, bye.
]]>For a brief period, I changed my configuration to use Optimus Manager instead of Bumblebee because I couldn't get my NVIDIA GPU to work with command optirun. I must admit that this always worked when I used Debian distro bases, but it's not a big deal for me to keep using Debian distros,
I love them as containers or production instances, but not on my desktop, I'm not a big fan of extra apt repositories, after updates some incompatibilities happen and packages may break, for me it's frequent because I'm a developer and I use so many packages 📦.
First, define Bumbleebee.

In the context of GPUs (Graphics Processing Units) and Linux, Bumblebee refers to a project that allows you to use a system's dedicated GPU (typically NVIDIA) for producing graphics while still using the integrated GPU for less demanding tasks. This is especially beneficial in laptops when running applications that do not require the full capabilities of the dedicated GPU.
Bumblebee's principal application is in laptops with dual GPUs, which include an integrated GPU (like Intel's integrated graphics) and a separate GPU (like NVIDIA). Bumblebee enables switching between various GPUs dependent on the application's graphical processing power requirements.
Here's an overview of how Bumblebee works:
- Integrated GPU (for example, Intel): Handles basic rendering and the desktop environment.
- Dedicated GPU (e.g., NVIDIA): Remains in a low-power state until a more graphics-intensive task requires it.
- Optimus Technology (NVIDIA): This is a technology that enables for the seamless switching of integrated and dedicated GPUs depending on the workload.
- Bumblebee: Serves as a bridge between Optimus Technology and the Linux operating system. It enables selected apps to use the dedicated GPU while keeping the rest of the system on the integrated GPU to save power.
It's worth noting that you can use simply NVIDIA while skipping your integrated GPU, but you'll sacrifice battery life for graphical acceleration.
If you purchased a Dell laptop 5 years ago, you may have chosen an Inspiron model with a dedicated GeForce GPU and integrated Intel Graphics. Nowadays, AMD Ryzen with GPU solves your challenges, and you don't require Bumblebee 😭.
Requirements
First, ensure that your Bumblebee service is running and in good health.
sudo systemctl status bumblebeed
● bumblebeed.service - Bumblebee C Daemon
     Loaded: loaded (/usr/lib/systemd/system/bumblebeed.service; enabled; preset: disabled)
     Active: active (running) since ...
You should start the service if it is not already operating.
# checkout logs
journalctl -u bumblebeed

# running service
sudo systemctl start bumblebeed
Using the optirun or primusrun commands
Both optirun and primusrun are commands that work in tandem with the Bumblebee project, which enables dynamic switching between integrated and dedicated GPUs on laptops equipped with NVIDIA Optimus technology. These commands accomplish similar tasks but differ in terms of performance and how they handle the rendering process.
- optirun: This Bumblebee project command is used to run a program with the dedicated GPU. It employs VirtualGL as a bridge, rendering graphics on the dedicated GPU before sending the output to the integrated GPU for display. The disadvantage is that the method includes duplicating frames between GPUs, which can increase overhead and degrade speed. Wine and Crossover, for example, may not work correctly in this way.
- primusrus: This command is part of the Bumblebee project as well, but it takes a different approach. It employs Primus as a VirtualGL backend in order to reduce the overhead involved with copying frames between GPUs. When compared to optirun, Primus seeks to improve performance by providing a more efficient approach to handle the rendering process, resulting in higher frame rates for GPU-intensive applications. Improved support for Wine and Crossover apps.
The file /etc/bumblebee/xorg.conf.nvidia that follows is an exact representation of the default settings generated by your Linux distribution, in this instance Manjaro Hardware Detection (mhwd).
##
## Generated by mhwd - Manjaro Hardware Detection
##

Section "ServerLayout"
    Identifier "Layout0"
    Option "AutoAddDevices" "false"
EndSection

Section "ServerFlags"
  Option "IgnoreABI" "1"
EndSection

Section "Device"
    Identifier  "Device1"
    Driver      "nvidia"
    VendorName "NVIDIA Corporation"
    Option "NoLogo" "true"
    Option "UseEDID" "false"
    Option "ConnectedMonitor" "DFP"
EndSection
Before performing the testing command, install glxgears from the mesa-utils package:
# manjaro pamac
sudo pamac install mesa-utils

# with pacman
sudo pacman -S mesa-utils
For tackling the issue, let us run primusrun and optirun with an application to test the graphics card.
optirun glxgears --info

primusrun glxgears --info
The result should be an issue bellow:
- Optirun
[ 9`634.005329] [ERROR]Cannot access secondary GPU - error: [XORG] (EE) No devices detected.

[ 9634.005368] [ERROR]Aborting because fallback start is disabled.
- Primusrun
primus: fatal: Bumblebee daemon reported: error: [XORG] (EE) No devices detected.
This problem occurred because the NVIDA configuration did not include the required BusID device for the dedicated GPU.
The command below will return your BusID devices.
lspci
The result:
08:00.0 3D controller: NVIDIA Corporation GK208BM [GeForce 920M] (rev a1)
08:00.1 Audio device: NVIDIA Corporation GK208 HDMI/DP Audio Controller (rev a1)
In this scenario, 08:00.0 is the BusID device for my NVIDIA dedicated GPU. So, in the configuration file /etc/bumblebee/xorg.conf.nvidia, specify this reference at section device (BusID "PCI:08:00:0"):
⚡ Please replace the dot with a colon in the suffix BusID. From PCI:08:00.0 to PCI:08:00:0
sudo nano /etc/bumblebee/xorg.conf.nvidia
##
## Generated by mhwd - Manjaro Hardware Detection
##


Section "ServerLayout"
    Identifier "Layout0"
    Option "AutoAddDevices" "false"
EndSection

Section "ServerFlags"
  Option "IgnoreABI" "1"
EndSection

Section "Device"
    Identifier  "Device1"
    Driver      "nvidia"
    VendorName "NVIDIA Corporation"
    Option "NoLogo" "true"
    Option "UseEDID" "false"
    Option "ConnectedMonitor" "DFP"
    BusID "PCI:08:00:0"
EndSection
We can now execute commands without trouble.
optirun glxgears --info

primusrun glxgears --info
Final thoughts
Today's article addresses a typical problem that happens after installing Manjaro if you have multiple Graphic Cards and use Bumblebee to manage them. Arch distributors may be aware of this issue. Thank you for reading. I hope this article helped you solve your problem and that you enjoy your games.
God bless 🕊️ your day and your kernel 🧠, and I hope to see you soon.
References
]]>A few weeks ago, I decided to switch from my latest desktop (Bugdie) to window managers. During my early experiences with Conectiva, Mandrake, and Slackware, I used Blackbox and thought it was fantastic, but I didn't know how to configure things at the time.
So I went back to KDE after trying GNOME, Deepin, Pantheon, XFCE and Bugdie. I became a distro Hopper 🕵️, looking into Desktop and enjoying and hating desktop behaviors. I never found a desktop that was comfy for me.
Why am I here using AwesomeWM rather than I3, BSPWM, XMonad, and other options? I haven't tried any of them yet, but the default theme and menu are similar to the old Blackbox and Fluxbox, and I'm not a Lua highlander developer 🔥, but the language is too simple, and in a few weeks I discovered various references at Git and significant AwesomeWM instructions, for developing my own dotfiles and widgets.
Before diving into AwesomeWM, let's take a quick look at Window Managers.
Window Manager
Is a software component that handles the placement and appearance of windows in an operating system's graphical user interface (GUI). It is in charge of managing the graphical elements on the screen, such as windows, icons, and other graphical elements, and it allows the user to interact with these items.
There are various types of window managers, which can be essentially divided into two categories:
Stacking Window Managers: These allow windows to overlap and allow the user to bring any window to the foreground by clicking on it: Blackbox, Openbox, Fluxbox and Window Maker are examples of stacking window managers
Tiling Window Managers: Tiling window managers organize windows so that they do not overlap. They tile windows to fill the available screen space automatically, which can be more efficient for certain tasks. Instead of using a mouse, users often browse between windows using keyboard shortcuts: I3, Awesome, BSPWM, DWM, XMonad, QTile and Hyprland are examples of tiling window managers.
It's important to note that tiling manager features arrive to come, so desktops as GNOME and KDE introduced tiling features.
AwesomeWM
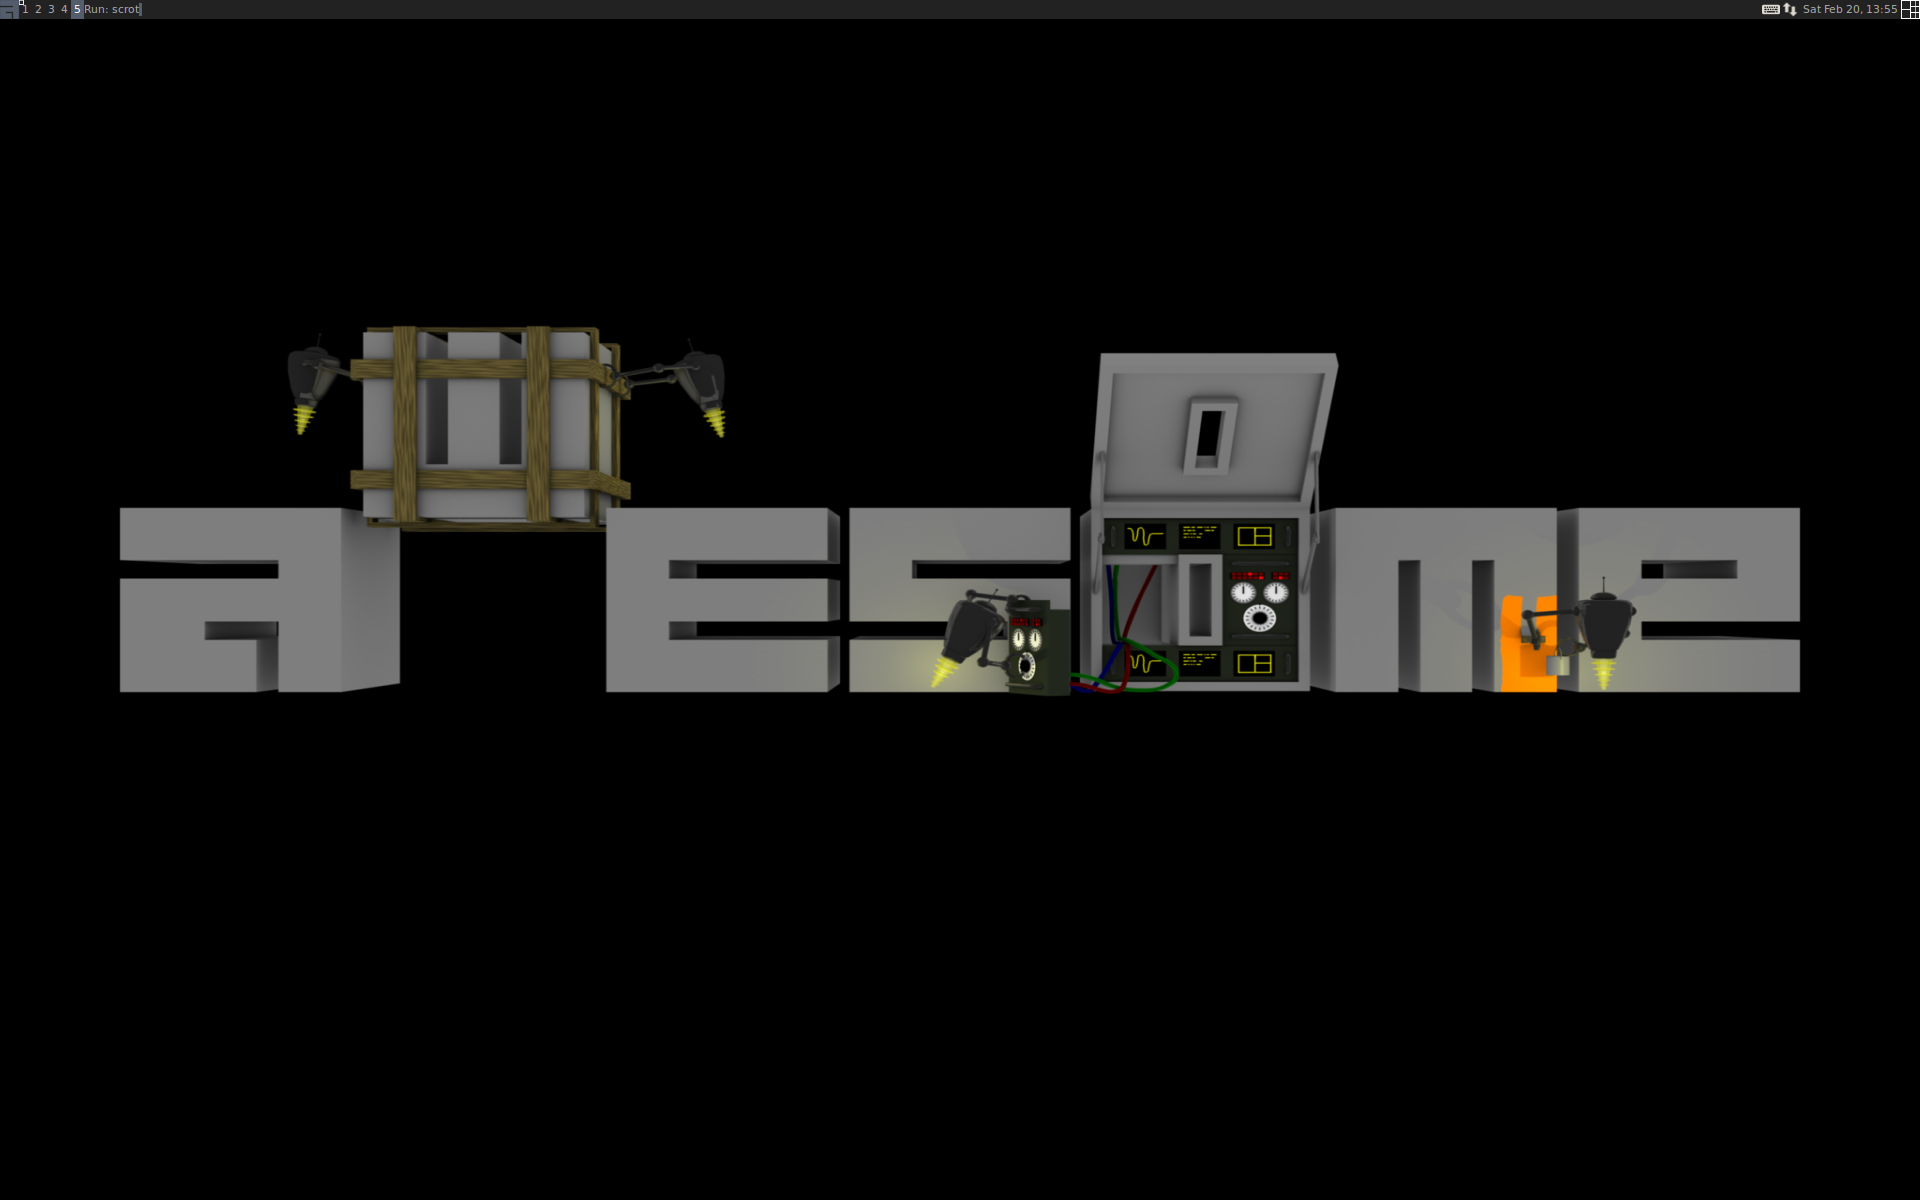
Awesome Window Manager is a highly customizable, dynamic tiling window manager for the X Window System (the windowing system used by Linux and other Unix-like operating systems). It is intended to be incredibly versatile and adaptable, giving users complete control over the layout and appearance of their desktop environment.
You can do everything you want with done widgets or by yourself with Lua development. I admit that I mixed the two. Creating something from scratch requires too much of you, and you can grow bored fixing and running it for too long, therefore I decided to base my theme on CopyCats. Because there are so many specifications involved in an environment, such as network, CPU, RAM, Graphic Card, Sound Card, Microphone, and so on, certain things may not work at first or with default settings.
CopyCats is a collection of themes on which you can tweak or build your own.
Template file
AwesomeWM has a file called rc.lua that contains all of the rules, behaviors, and styles for windows. This file contains comments that separate the template settings into sections.
The file is located by default at /etc/xdg/awesome/rc.lua, and you must copy it to your home location to make your changes.
sudo cp /etc/xdg/awesome/rc.lua $HOME/.config/awesome/00.rc.lua
I have no intention of describing a full template, but I will highlight key areas to demonstrate how AwesomeWM works.
Menu
You can attach instructions or functions to a menu or sub-menu, but keep in mind that you can use launcher to execute your apps, of which I choose Rofi.
-- {{{ Menu
-- Create a launcher widget and a main menu
myawesomemenu = {
   { "hotkeys", function() hotkeys_popup.show_help(nil, awful.screen.focused()) end },
   { "manual", terminal .. " -e man awesome" },
   { "edit config", editor_cmd .. " " .. awesome.conffile },
   { "restart", awesome.restart },
   { "quit", function() awesome.quit() end },
}
Tags (environments)
You can have as many environments as you desire, and you can access them with the (⊞ window key + arrows) shortcut.
screen.connect_signal("request::desktop_decoration", function(s)
    -- Each screen has its own tag table.
    awful.tag({ "1", "2", "3", "4", "5", "6", "7", "8", "9" }, s, awful.layout.layouts[1])
end)
Keybindings
You can define or edit any keybinding. The shortcut (⊞ window key + s) displays guidelines for all shortcuts defined in your template, which is very useful.
awful.keyboard.append_global_keybindings({
    awful.key({ modkey,           }, "s",      hotkeys_popup.show_help,
              {description="show help", group="awesome"})
})
Bars
Wibar is highly adaptable; you may specify a widget or group, as well as determine alignment, spacing, and margins. I tried using Polybar at first, but I didn't like the outcome. However, if you want to switch to another Window Manager, Polybar works in the majority of them.
s.mywibox = awful.wibar {
position = "top",
screen   = s,
widget   = {
    layout = wibox.layout.align.horizontal,
    { -- Left widgets
        layout = wibox.layout.fixed.horizontal,
        mylauncher,
        s.mytaglist,
        s.mypromptbox,
    },
    s.mytasklist, -- Middle widget
    { -- Right widgets
        layout = wibox.layout.fixed.horizontal,
        mykeyboardlayout,
        wibox.widget.systray(),
        mytextclock,
        s.mylayoutbox,
    },
}
Now we'll look at templates. I don't recommend employing templates as your final work; instead, separate them into numerous files. Divide and conquer is usually a good method for organizing and keeping your code as professional as possible. Everything in the template is grouped together on purpose to present all settings in a single file; this file is a dump.
Compositor
In the same way that XFCE utilizes compiz to add blur, transparency, and graphical effects to windows, we must use picom to add cosmetic features to Awesome WM.
My Awesome WM theme
After weeks of working in this environment, I created something I enjoyed; there is still more work to be done, but I'm happy with my shortcuts and environment feedback. My son accompanied me on this journey and was continuously saying to me, "let me see your little top bar" or "barrinha" in Portuguese.
This theme was named Ebenezer 🪨, which meaning "stone of helper.".
The quote is from I Samuel 7. After defeating the Philistines, Samuel raises his Ebenezer, declaring that God defeated the enemies on this spot. As a result, "hither by thy help I come." So I hope this stone helps you in your environment and, more importantly, in your life. 🙏🏿
Of course, this top-bar is inspired by others, but I keep what's really important to me to monitor and track, memory, temperature, and CPU, and when something exceeds the indicators colors change, similar to our dashboards at developer context. The battery exhibits the same expected behavior.

I appreciate the idea of keybindings, but for some tasks, I utilize mouse behaviors, such as microphone muting, opening wifi-manager, and tool tips that provide useful information such as wifi signal, current brightness, and battery state.
Following that, I'll explain what this implementation does, and you can clone it if you like; this theme is incredibly adaptable. I'm attempting to keep everything changeable via ini files, therefore there's a file called config.ini where you can customize style and behaviors.
The config.ini
[environment]
modkey=Mod4
weather_api_key=api_weather_key # openweathermap.org
city_id=your_city_id # openweathermap.org
logo=$THEMES/icons/tux.png
logo_icon=
logo_icon_color=#34be5b
wallpaper_slideshow=on # [off] wallpaper solo
wallpaper=$HOME/Pictures/Wallpapers/active.jpg # wallpaper solo
wallpaper_dir=$HOME/Pictures/Wallpapers # when wallpaper_slideshow=on you should inform wallpapers directory
terminal=kitty
editor=nano
icon_theme="Papirus"
icon_widget_with=22
[commands]
lock_screen=~/.config/i3lock/run.sh
brightness_level=light -G
brightness_level_up=xbacklight -inc 10
brightness_level_down=xbacklight -dec 10
power_manager=xfce4-power-manager --no-daemon
network_manager=nm-connection-editor
cpu_thermal=bash -c "sensors | sed -rn \"s/.*Core 0:\\s+.([0-9]+).*/\1/p\""
click_logo=manjaro-settings-manager
volume_level=pactl list sinks | grep '^[[:space:]]Volume:' | head -n $(( $SINK + 1 )) | tail -n 1 | sed -e 's,.* \([0-9][0-9]*\)%.*,\1,'
[wm_class]
browsers=firefox chromium-browser microsoft-edge
editors=code-oss sublime atom
[tags]
list=
browsers=1
terminal=2
editors=3
games=4
files=5
others=6
[topbar]
left_widgets=tag_list separator task_list
right_widgets=weather cpu_temp cpu mem arrow arrow_volume arrow_microphone arrow_network arrow_battery arrow_systray arrow_pacman arrow_brightness arrow_logout arrow_layoutbox
[startup]
picom=picom --config $THEMES/picom.conf
lock_screen=light-locker --lock-after-screensaver=10 &
desktop_policies=lxpolkit # default file polices (open files from browser)
multiple_screen=exec ~/.config/xrandr/startup.sh "1366x768" # type xrandr to check supported mode
mouse_reset=unclutter
[fonts]
font=Fira Code Nerd Font Bold 10
font_regular=Fira Code Nerd Font Medium 9
font_light=Fira Code Nerd Font Light 10
font_strong=Fira Code Nerd Font 12
font_strong_bold=Inter Bold 12
font_icon=Fira Code Nerd Font 11
[colors]
fg_normal=#e0fbfc
fg_focus=#C4C7C5
fg_urgent=#CC9393
bg_normal=#263238
bg_focus=#1E2320
bg_urgent=#424242
bg_systray=#e0fbfc
bg_selected=#5c6b73
fg_blue=#304FFE
fg_ligth_blue=#B3E5FC
fg_yellow=#FFFF00
fg_red=#D50000
fg_orange=#FFC107
fg_purple=#AA00FF
fg_purple2=#6200EA
fg_green=#4BC1CC
bg_topbar=#253237
bg_topbar_arrow=#5c6b73
border_color_normal=#9db4c0
border_color_active=#c2dfe3
border_color_marked=#CC9393
titlebar_bg_focus=#263238
titlebar_bg_normal=#253238
As you can see, there are numerous settings, however I must admit that there are numerous items to include in this file.
Features
Changing the wallpaper when using the slide show mode
Screenshot desktop, window, delayed and area
The screenshot default place is $HOME/Pictures/Screenshots

Notifications feedback's

Launcher (rofi)
Lock screen (i3lock)

Tooltip

Terminal
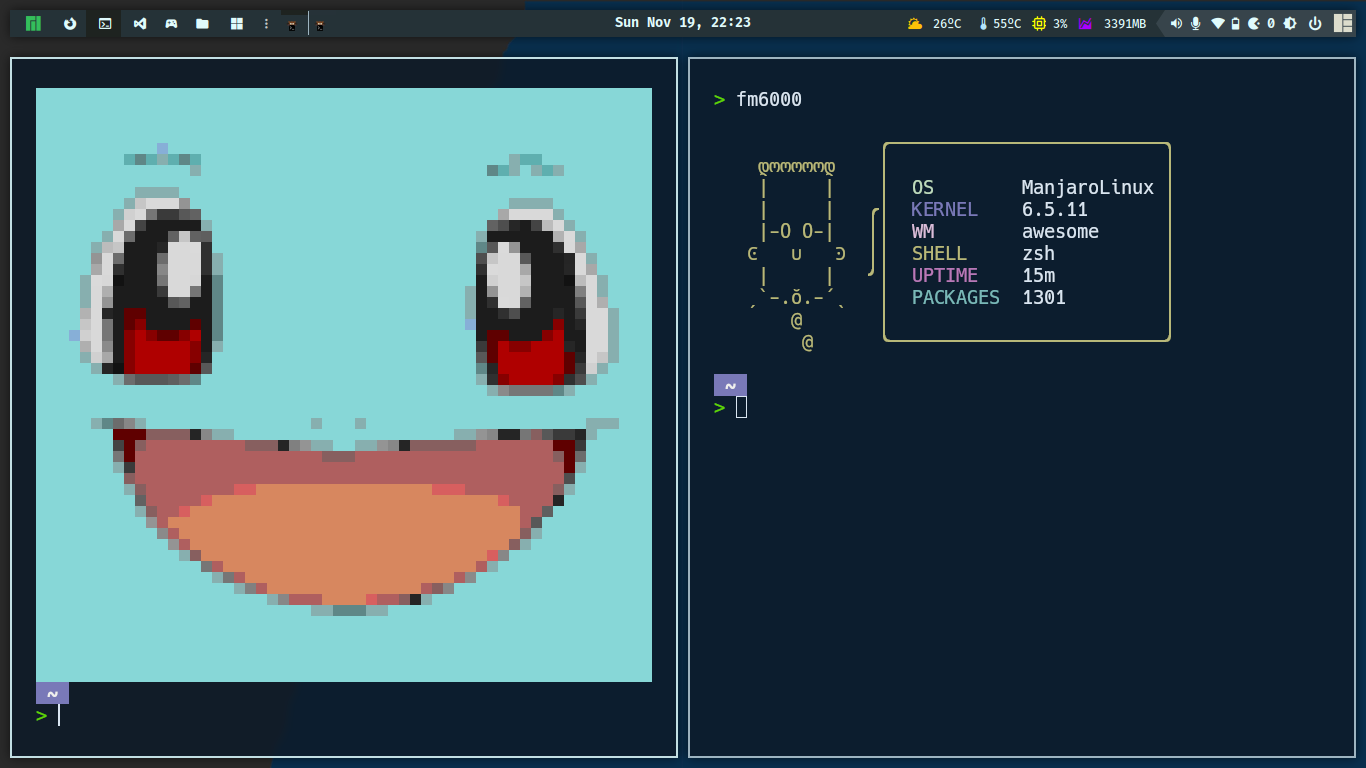
🎮 Not only a coder, but also a daddy developer, I was playing Roblox with my son while Wine Vinegar consuming and harming my CPU.

Features development
Some features were created from scratch, while others were discovered on Github and changed to my way and style.
If you feel the same way I do, where KDE, GNOME, Mate, XFCE, Cinnamon are too much for you, go with Awesome WM, which is my dotfiles:
williampsenaThat's all folks
In this piece, I'll explain how Awesome WM works and give some useful dotfiles. As a developer, I hope you find this material valuable on a daily basis.
I'll see you again soon, and please keep your kernel 🧠 up to date and God bless 🙏🏿 you.
Python Lover ? ❤️
Give a try to a Tiling Window Manager built in Python and fully customized.

Graceful shutdown is a process that is well stated in twelve factors; in addition to keeping applications with 🏁 fast and furious launch, we need be concerned with how we dispose of every application component. We're not talking about classes and garbage collector. This topic is about the interruption, which could be caused by a user stopping a program or a container receiving a signal to stop for a scaling operation, swapping from another node, or other things that happen on a regular basis while working with containers.
Imagine an application receiving requests for transaction payments and an interruption occurs; this transaction becomes lost or incomplete, and if retry processing or reconciliation is not implemented, someone will need to push a button to recover this transaction...

We should agree that manual processing works at first, but every developer knows the end...
How does graceful shutdown work?
When your application begins to dispose, you can stop receiving more demands; these demands could be a message from a queue or topic; if we're dealing with workers, this message should return to the queue or topic; Rabbit provides a message confirmation (ACK) that performs a delete message from the queue that is successfully processed by the worker. In container contexts, this action should be quick to avoid a forced interruption caused by a long waiting time.
Show me the code!
You may get the source code from my Github repository.
The following code shows a basic application that uses signals to display Dragon Ball 🐲 character information every second. When interruption signal is received the timer responsible to print messages per second is stopped. In this example, we're using simple timers, but it could also be a web server or a worker connected into a queue, as previously said. Many frameworks and components include behaviors for closing and waiting for incoming demands.
- app.go
package main

import (
	"encoding/csv"
	"fmt"
	"math/rand"
	"os"
	"os/signal"
	"syscall"
	"time"
)

const blackColor string = "\033[1;30m%s\033[0m"

var colors = []string{
	"\033[1;31m%s\033[0m",
	"\033[1;32m%s\033[0m",
	"\033[1;33m%s\033[0m",
	"\033[1;34m%s\033[0m",
	"\033[1;35m%s\033[0m",
	"\033[1;36m%s\033[0m",
}

type Character struct {
	Name        string
	Description string
}

func main() {
	printHello()

	sigs := make(chan os.Signal, 1)
	signal.Notify(sigs, syscall.SIGINT, syscall.SIGTERM)

	fmt.Println("Starting random Dragon Ball characters service...")

	shutdown := make(chan bool, 1)

	go func() {
		sig := <-sigs
		fmt.Println()
		fmt.Println(sig)
		shutdown <- true
	}()

	characterSize, characterList := readFile()

	quit := make(chan struct{})

	go func() {
		ticker := time.NewTicker(5 * time.Second)
		for {

			select {
			case <-ticker.C:
				printMessage(characterSize, characterList)
			case <-quit:
				ticker.Stop()
				return
			}
		}
	}()

	<-shutdown

	close(quit)

	fmt.Println("Process gracefully stopped.")
}

func printHello() {
	dat, err := os.ReadFile("ascii_art.txt")

	if err != nil {
		panic(err)
	}

	fmt.Println(string(dat))
}

func readFile() (int, []Character) {
	file, err := os.Open("dragon_ball.csv")

	if err != nil {
		panic(err)
	}

	csvReader := csv.NewReader(file)
	data, err := csvReader.ReadAll()

	if err != nil {
		panic(err)
	}

	characterList := buildCharacterList(data)

	file.Close()

	return len(characterList), characterList
}

func buildCharacterList(data [][]string) []Character {
	var characterList []Character

	for row, line := range data {
		if row == 0 {
			continue
		}

		var character Character

		for col, field := range line {
			if col == 0 {
				character.Name = field
			} else if col == 1 {
				character.Description = field
			}
		}

		characterList = append(characterList, character)
	}

	return characterList
}

func printMessage(characterSize int, characterList []Character) {
	color := colors[rand.Intn(len(colors))]
	characterIndex := rand.Intn(characterSize)
	character := characterList[characterIndex]

	fmt.Printf(color, fmt.Sprintf("%s %s", "🐉", character.Name))
	fmt.Printf(blackColor, fmt.Sprintf(" %s\n", character.Description))
}
- go.mod
module app

go 1.20
Code Highlights
- This code block prepares the application to support signals; shutdown is a channel that, when modified, triggers an execution block for disposal.
	sigs := make(chan os.Signal, 1)
	signal.Notify(sigs, syscall.SIGINT, syscall.SIGTERM)

	shutdown := make(chan bool, 1)

	go func() {
		sig := <-sigs
		fmt.Println()
		fmt.Println(sig)
		shutdown <- true
	}()
- The ticker is in charge of printing messages every 5 seconds; when it receives a signal from the quit channel, it stops.
quit := make(chan struct{})

go func() {
    ticker := time.NewTicker(5 * time.Second)
    for {

        select {
        case <-ticker.C:
            printMessage(characterSize, characterList)
        case <-quit:
            ticker.Stop()
            return
        }
    }
}()
- The ticker is closed by "quit channel" after receiving a signal halting the application's execution.
<-shutdown

	close(quit)

	fmt.Println("Process gracefully stopped.")
Graceful Shutdown working
When CTRL+C is pressed, the application receives the signal SIGINT, and disposal occurs, the following command will launch the application.
go run app.go
Containers
It's time to look at graceful shutdown in the container context; in the following file, we have a container image:
- Containerfile
FROM docker.io/golang:alpine3.17

MAINTAINER [email protected]

WORKDIR /app

COPY ./graceful_shutdown go.mod /app

RUN go build -o /app/graceful-shutdown

EXPOSE 3000

CMD [ "/app/graceful-shutdown" ]
Let's build a container image:
docker buildx build -t graceful-shutdown -f graceful_shutdown/Containerfile .

# without buildx
docker build -t graceful-shutdown -f graceful_shutdown/Containerfile .

# for podmans
podman build -t graceful-shutdown -f graceful_shutdown/Containerfile .
The following command will test the execution, logs, and stop that is in charge of sending signals to the application; if no signals are received, Docker will wait a few seconds and force an interruption:
docker run --name graceful-shutdown -d -it --rm graceful-shutdown
docker logs -f graceful-shutdown

# sent signal to application stop
docker stop graceful-shutdown

# Using
# Podman

podman run --name graceful-shutdown -d -it --rm graceful-shutdown
podman logs -f graceful-shutdown

# sent signal to application stop
podman stop graceful-shutdown
That's all folks
In this article, I described how graceful shutdown works and how you may apply it in your applications. Implementing graceful shutdown is part of a robust process; we should also examine how to reconcile a processing when a server, node, or network fails, so we should stop thinking just on the happy path.
I hope this information is useful to you on a daily basis as a developer.
I'll see you next time, and please keep your kernel 🧠 updated.