Today I'm going to show you how to use Traefik locally with Podman, my favorite Edge Router, to publish services with route matching, authentication, and other middlewares in an outstanding way.
Requirements
We require Podman to run containers locally; if you want an introduction, I wrote the following articles:


Podman SystemD Socket
Start the Podman systemd socket, as Traefik requires it to handle containers:
systemctl --user start podman.socketIf you prefer, you can set it to start immediately on boot:
systemctl --user enable podman.socketWhat is Traefik?
Traefik is a modern HTTP reverse proxy and load balancer developed in Go that is suited for microservice architecture. It is commonly used in containerized environments, such as Docker and Kubernetes.
There are no official Podman docs on how to make things work with Podman, although a few months ago I saw some examples using Podman Socket, similar to how Traefik works with Docker.
Traefik dynamically detects services as they are introduced to the infrastructure and routes traffic to them, making applications easier to manage and grow.
Major features:
- Automatic Service Discovery: Traefik can detect new services as they are introduced to your infrastructure, removing the need for human configuration.
- Dynamic Configuration: It can reorganize itself as services scale up or down, making it ideal for dynamic contexts like as container orchestration platforms.
- Load Balancing: Traefik includes built-in load balancing capabilities for distributing incoming traffic over many instances of a service.
- Automatic TLS: It may supply TLS certificates from Let's Encrypt, enabling HTTPS by default without requiring manual configuration.
- Dashboard: Traefik includes a web dashboard and a RESTful API, which enable operators to monitor and manage traffic routing and configuration.
- Middleware Support: It supports a number of middleware plugins for features like authentication, rate limiting, and request rewriting.
- Multiple Backends: Traefik can route traffic to multiple backend services based on various criteria like path, headers, or domain names.
Goals
The purpose is creating an example of using Podman Kube, a Kubernetes Deployment style to run pods. Traefik has a defined deployment schema. This article will introduce a way for annotating containers with labels.
Traefik communicates directly with Docker or Podman socket to listen for container creations and define routes and middlewares for them.
Please show the code that is working!

Deployments
- traefik.yaml
This file demonstrates a Traefik pod deployment that listens on ports 8000 and 8001.
apiVersion: v1
kind: Pod
metadata:
  name: traefik
  labels:
    app: traefik
spec:
  containers:
  - name: traefik
    image: docker.io/library/traefik:v3.0
    args:
    - '--accesslog=true'
    - '--api.dashboard=true'
    - '--api.insecure=true'
    - '--entrypoints.http.address=:8000'
    - '--log.level=info'
    - '--providers.docker=true'
    volumeMounts:
    - mountPath: /var/run/docker.sock:z
      name: docker_sock
    ports:
    - containerPort: 8000
      hostPort: 8000
      protocol: TCP
    - containerPort: 8080
      hostPort: 8001
      protocol: TCP
  restartPolicy: Never
  dnsPolicy: Default
  volumes:
  - name: docker_sock
    hostPath:
      path: "/run/user/1000/podman/podman.sock"
      type: File
Please check the location of your podman.sock, the default user is 1000, and the sock is typically found in /run/user/1000/podman/podman.sock.
- whoami.yaml
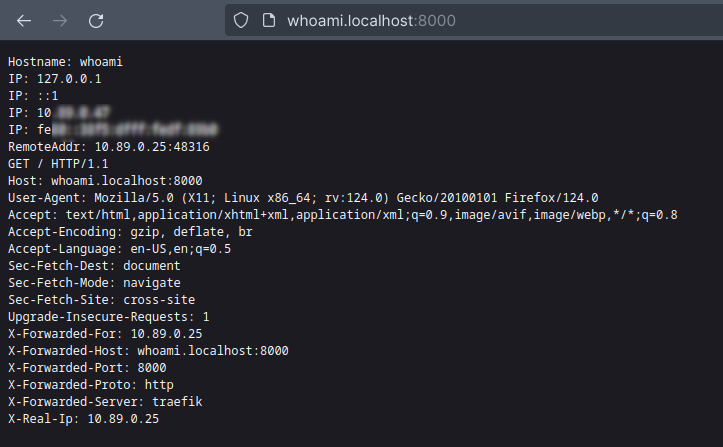
This file shows a replica of a simple HTTP container that returns container-specific information such as IP and host name for debugging.
Traefik uses container labels or annotations to define rules.
- traefik.http.routers.whoami.rule: specifies match rules for reaching the container, which can be host, header, path, or a combination of these.
- traefik.http.services.whoami.loadbalancer.server.port: specifies the port on which the container is listening.
apiVersion: v1
kind: Pod
metadata:
  name: whoami
  labels:
    traefik.http.routers.whoami.rule: Host(`whoami.localhost`)
    traefik.http.services.whoami.loadbalancer.server.port: 3000
spec:
  containers:
  - name: whoami
    image: docker.io/traefik/whoami:latest
    ports:
    - containerPort: 3000
      protocol: TCP
    env:
    - name: WHOAMI_PORT_NUMBER
      value: 3000
  restartPolicy: Never
  dnsPolicy: Default
🫠Unfortunately, replicas are not supported. If we had replicas, Traefik would handle them using round-robin to reach each container, as Traefik works with Docker Swarm and Kubernetes.
- whoami-secure.yaml
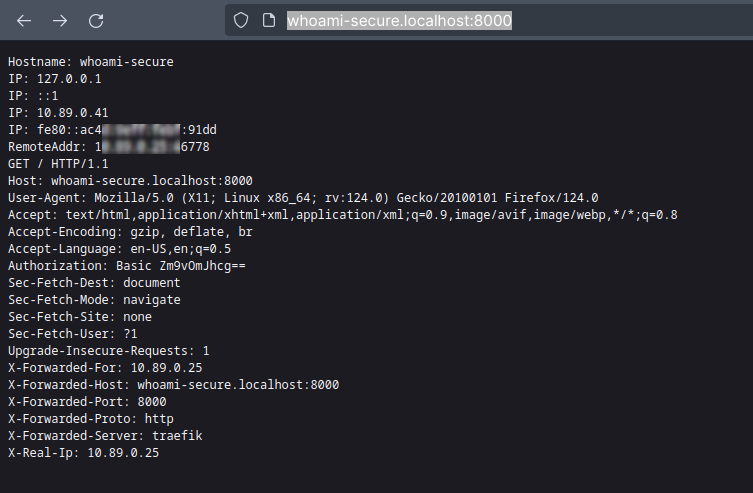
This file describes the same service but includes the Basic Auth middleware to demonstrate how to utilize middlewares.
- traefik.http.routers.{route-name}.middlewares: specifies the middlewares utilized in the current container.
- traefik.http.middlewares.{middleware-name}.basicauth.users: specifies the user and passwords.
You can generate htpassword with the following command:
docker run --rm -ti xmartlabs/htpasswd <username> <password> > htpasswd
apiVersion: v1
kind: Pod
metadata:
  name: whoami-secure
  labels:
    traefik.http.routers.whoami-secure.rule: Host(`whoami-secure.localhost`)
    traefik.http.services.whoami-secure.loadbalancer.server.port: 3000
    traefik.http.routers.whoami-secure.middlewares: auth
    traefik.http.middlewares.auth.basicauth.users: foo:$2y$05$.y24r9IFaJiODuv41ool7uLyYdc4H4pDZ5dSKkL.Z/tUg3K3NancS
spec:
  containers:
  - name: whoami-secure
    image: docker.io/traefik/whoami:latest
    ports:
    - containerPort: 3000
      protocol: TCP
    env:
    - name: WHOAMI_PORT_NUMBER
      value: 3000
  restartPolicy: Never
  dnsPolicy: Default
It is critical to note that only Traefik exposes a port to hosting; Traefik centralizes all traffic, proxying each request dealing with IP and listening port from each container.
Running
podman play kube pods/traefik/traefik.yaml
podman play kube pods/traefik/whoami.yaml
podman play kube pods/traefik/whoami-secure.yaml
Testing
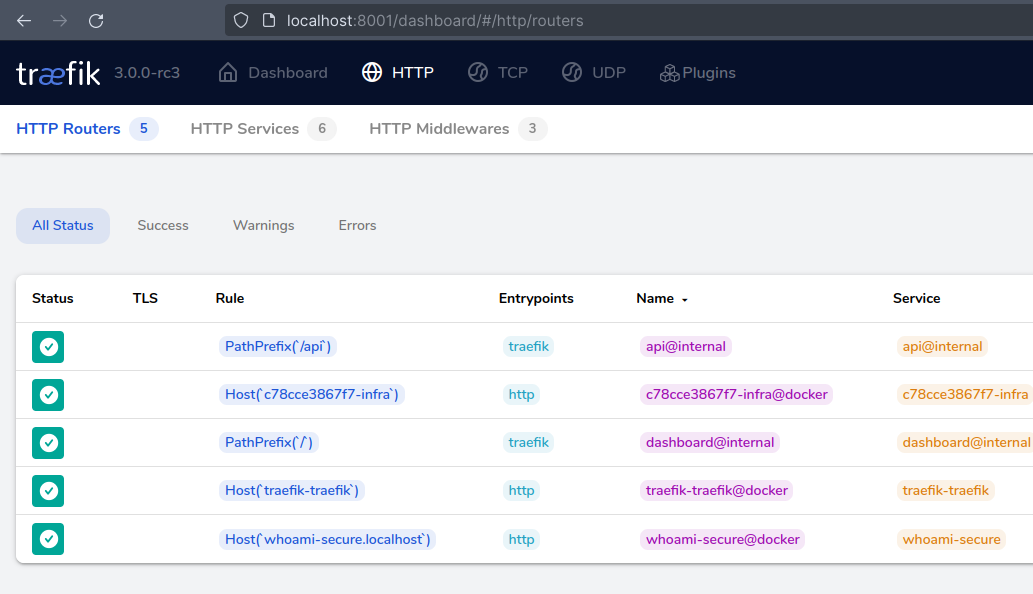
You can view Traefik Dashboard at port 8001, which displays importing information about Routes and Containers.
Let we test the Whoami route at endpoint http://whoami.localhost:8000/:
We can now check the Whoami route using basic authentication with the username "foo" and password "bar" at http://whoami-secure.localhost:8000/
Troubleshooting
If hosts is not resolving you may need to add to /etc/hosts.
127.0.0.1 localhost whoami.localhost whoami-secure.localhost
Code
💡 Feel free to clone this repository, which contains related files:
 williampsena
Tearing down
podman play kube --down pods/traefik/traefik.yaml
podman play kube --down pods/traefik/whoami.yaml
podman play kube --down pods/traefik/whoami-secure.yaml
That's it
In this post, we will demonstrate how Traefik works, how to build settings to reach containers, and how to use middleware to use the full capability of container orchestration. I recommend that you look into Traefik middlewares; they can be more beneficial than an API Gateway at times.
Please keep your kernel 🧠 updated God bless 🕊️ you. I'll share a quote:
Whatever you do, work at it with all your heart, as working for the Lord, not for human masters. Colossians 3:23
References
]]>In this article, I'll show you how to deploy the lambda that we constructed in the previous section. This time, we need to set up AWS in preparation for deployment.
If you missed Part 1, please read it first.

No costs!
To test deployments, there is no cost; Amazon has a free tier for lambdas, so you can deploy as many lambdas as you want; you will pay once you exceed the following limits:
- 1 million free requests per month
- 3.2 million seconds of compute time per month
⚡ So be careful to write any lambdas that involve image or video processing, or that run for a long duration of time, because you'll most likely pay for it, and keep in mind that there is a 900-second execution limit (15 minutes).

Requirements
- Please create your AWS account to test deployment.
AWS Access Key
After you've created your account, you'll need to create a user and set your AWS_ACCESS_KEY_ID, AWS_SECRET_ACCESS_KEYPerhaps you are receiving a privilege-related problem; check to see if you have missed any policies for your user., and AWS_DEFAULT_REGION environment variables.
You can set these values in your profile (.bashrc, .zshrc, .profile, or bash_profile).
export AWS_ACCESS_KEY_ID="YOUR_ACCESS_KEY_ID"
export AWS_SECRET_ACCESS_KEY="YOUR_ACCESS_KEY"
export AWS_DEFAULT_REGION="YOUR DEFAULT REGION or us-east-1"
Group and privileges
Now we need to assign some privileges to your user, who will be in charge of deploying AWS Lambda through Serverless, Create a group, attach it to your created user, and provide the following permissions:
- AmazonAPIGatewayAdministrator
- AWSCloudFormationFullAccess
- AWSCodeDeployFullAccess
- AWSCodeDeployRoleForLambda
- AWSLambdaBasicExecutionRole
- AWSLambdaFullAccess
Role for AWS Lambda execution
If you did not specify an iam/role before deployment, Serverless will manage a user for you if the user has permission to create roles. In this example, I tried not to use this magic; in my opinion, allowing a tool to set your lambda permissions is not a good idea...

Then let's create some roles; we can ask Amazon help to create a Lambda-specific user, as I did below:
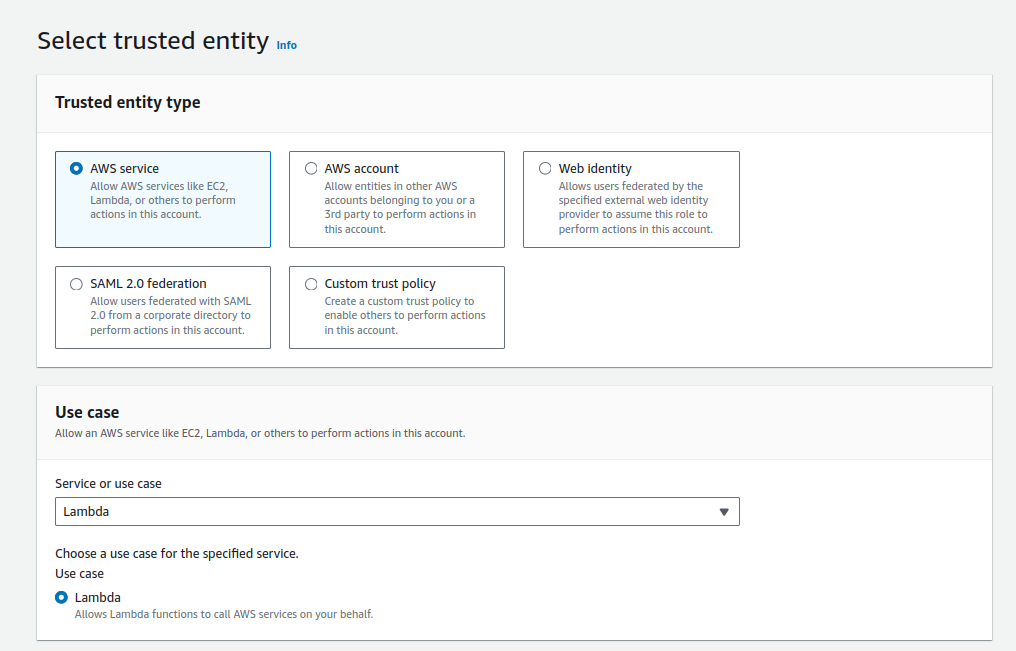
After we create this role, you must copy the ARN and specify it at deployment.
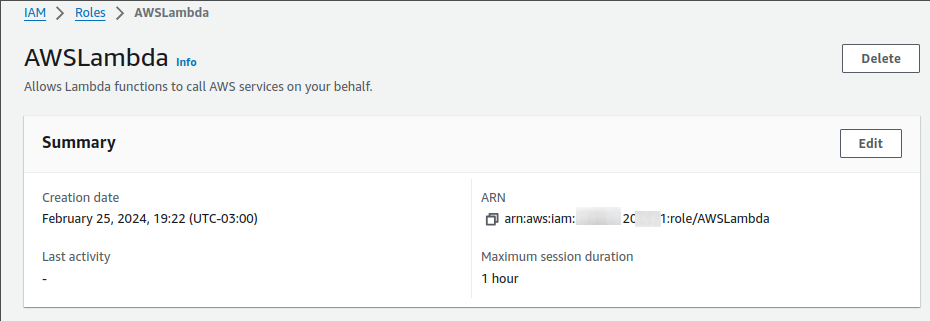
This is fantastic, however we construct a Lambda user who has access to any AWS resource, thus it's an excellent security question for production scenarios. I recommend that you create something specifically for your lambda. It's hard but safe.
service: service-currencies
frameworkVersion: "3"

provider:
  name: aws
  runtime: nodejs18.x
  iam:
    role: arn:aws:iam::12345678:role/AWSLambda

functions:
  api:
    handler: handler.listCurrencies
    events:
      - httpApi:
          path: /
          method: get
plugins:
  - serverless-plugin-typescript
  - serverless-offline

package:
  patterns:
    - '!node_modules/**'
    - 'node_modules/node-fetch/**'
The latest lines in the file refer to skipping node_modules during package deployment.
Deploy
If everything is set up correctly, the deployment will be successful. As an ordinary Friday deployment. 😜
SLS_DEBUG=* sls deploy --verbose
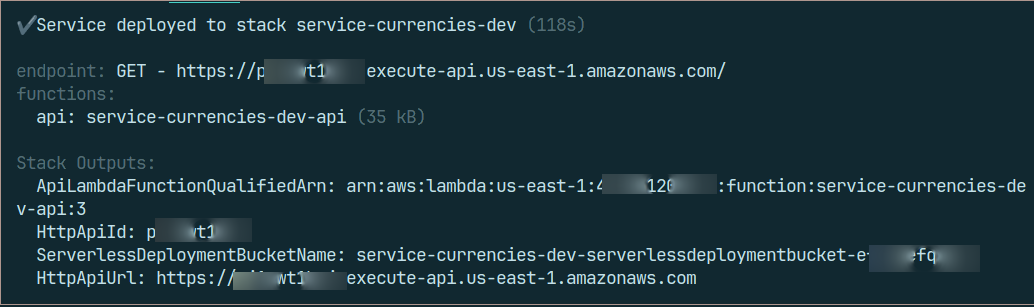
That's it; your public service has been deployed, and you may test the ApiUrl exposed after deployment.
Issues
- Perhaps you are receiving a privilege-related problem; check to see if you have missed any policies for your user.
- Remember to configure your AWS keys in your profile or via a shell session if you want.
Removing
To avoid spending money 💸 on a public test route, use the following command to remove your lambda function.
SLS_DEBUG=* sls remove
That's all
Thank you for your attention, I hope that my piece has helped you understand something about Lambda and has encouraged you to learn more about not only AWS but also Cloud.
Please keep your kernel 🧠 updated. God gives us blessings 🕊️.
References
]]>Today I'll teach you how to create an AWS Lambda using a Serverless framework, as well as how to structure and manage your functions as projects in your repository. Serverless provides an interface for AWS settings that you may configure in your deployment configurations and function permissions for any service, including S3, SNS, SQS, Kinesis, DynamoDB, Secret Manager, and others.
AWS Lambda
Is a serverless computing solution offered by Amazon Web Services. It lets you run code without having to provision or manage servers. With Lambda, you can upload your code as functions, and AWS will install, scale, and manage the infrastructure required to perform those functions.
AWS Lambda supports a variety of programming languages, including:
- Node.js
- Python
- Java
- Go
- Ruby
- Rust
- .NET
- PowerShell
- Custom Runtime, such as Docker container
First things first

First, you should set up your Node.js environment; I recommend using nvm for this.
The serverless CLI must now be installed as a global npm package.
# (npm) install serverless as global package
npm install -g serverless

# (yarn)
yarn global add serverless
Generating the project structure
Following command will create a Node.js AWS lambda template.
serverless create --template aws-nodejs --path hello-world
Serverless Offline and Typescript support
Let's add some packages to the project.
npm install -D serverless-plugin-typescript typescript serverless-offline

# yarn

yarn add -D serverless-plugin-typescript typescript serverless-offline

# pnpm

pnpm install -D serverless-plugin-typescript typescript serverless-offline
Show the code

If you prefer, you can clone the repository.
- hello_world/selector.ts
This file includes the function that converts external data to API contracts.
import { CurrencyResponse } from './crawler'

export type Currency = {
  name: string
  code: string
  bid: number
  ask: number
}

export const selectCurrencies = (response: CurrencyResponse) =>
  Object.values(response).map(
    currency =>
      ({
        name: currency.name,
        code: currency.code,
        bid: parseFloat(currency.bid),
        ask: parseFloat(currency.ask),
      } as Currency)
  )

export default {
  selectCurrencies,
}
- hello_world/crawler.ts
This file contains the main function, which retrieves data from a JSON API using currency values.
export type CurrencySourceData = {
  code: string
  codein: string
  name: string
  high: string
  low: string
  varBid: string
  pctChange: string
  bid: string
  ask: string
  timestamp: string
  create_date: string
}

export type CurrencyResponse = Record<string, CurrencySourceData>

export const apiUrl = 'https://economia.awesomeapi.com.br'

export async function getCurrencies(currency) {
  const response = await fetch(`${apiUrl}/last/${currency}`)

  if (response.status != 200)
    throw Error('Error while trying to get currencies from external API')

  return (await response.json()) as CurrencyResponse
}

export default {
  apiUrl,
  getCurrencies,
}
- hello_world/handler.ts
Now we have a file containing a function that acts as an entrypoint for AWS Lambda.
import { getCurrencies } from './crawler'
import { selectCurrencies } from './selector'
import { APIGatewayProxyEvent, APIGatewayProxyResult } from 'aws-lambda'

const DEFAULT_CURRENCY = 'USD-BRL,EUR-BRL,BTC-BRL' as const

export async function listCurrencies(
  event: APIGatewayProxyEvent
): Promise {
  try {
    const currency = event.queryStringParameters?.currency || DEFAULT_CURRENCY
    const currencies = selectCurrencies(await getCurrencies(currency))

    return {
      statusCode: 200,
      body: JSON.stringify(currencies, null, 2),
    }
  } catch (e) {
    console.error(e.toString())

    return {
      statusCode: 500,
      body: '🫡 Something bad happened',
    }
  }
}

export default {
  listCurrencies,
}
💡The highlight lines indicate that if we had more than one function on the same project, we could wrap promises to centralize error handling.
- hello_world/serverless.yml
This file explains how this set of code will run on AWS servers.
service: service-currencies
frameworkVersion: "3"

provider:
  name: aws
  runtime: nodejs18.x

functions:
  api:
    handler: handler.listCurrencies
    events:
      - httpApi:
          path: /
          method: get
plugins:
  - serverless-plugin-typescript
  - serverless-offline
- hello_world/tsconfig.json
The Typescript settings.
{
  "compilerOptions": {
    "preserveConstEnums": true,
    "strictNullChecks": true,
    "sourceMap": true,
    "allowJs": true,
    "target": "es5",
    "outDir": "dist",
    "moduleResolution": "node",
    "lib": ["es2015"],
    "rootDir": "./"
  }
}
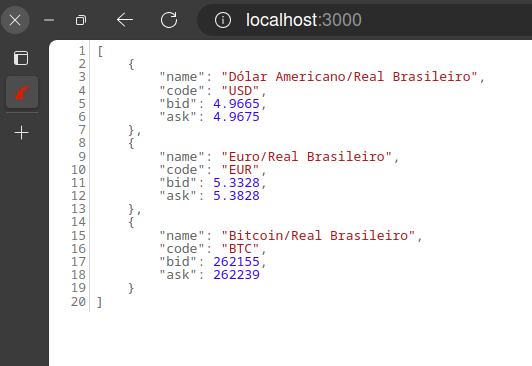
Execution
Let's test the serverless execution with following command:
SLS_DEBUG=* serverless offline

# or

SLS_DEBUG=* sls offline
You can look at the API response at http://localhost:3000.
We can run lambda locally without the Serverless offline plugin and get the result in the shell:
sls invoke local -f api
Tests
I use Jest to improve test coverage and illustrate how to use this wonderful approach, which is often discussed but not frequently utilized but should be 😏. I'm not here to claim full coverage, but some coverage is required.
- hello_world/__tests__ /handler.spec.ts
import {
  APIGatewayProxyEvent,
  APIGatewayProxyEventQueryStringParameters,
} from 'aws-lambda'
import { listCurrencies } from '../handler'
import fetchMock = require('fetch-mock')
import { getFixture } from './support/fixtures'

describe('given listen currencies http request', function () {
  beforeEach(() => fetchMock.restore())

  it('should raise error when Currency param is empty', async function () {
    fetchMock.mock(/\/last\//, { status: 404, body: '' })

    const event = { queryStringParameters: {} } as APIGatewayProxyEvent

    const result = await listCurrencies(event)

    expect(result).toEqual({
      body: '🫡 Something bad happened',
      statusCode: 500,
    })
  })

  it('should return currency list', async function () {
    fetchMock.mock(/\/last\//, {
      status: 200,
      body: getFixture('list_currencies_ok.json'),
    })

    const event = {
      queryStringParameters: {
        currency: 'USD-BRL,EUR-BRL,BTC-BRL',
      } as APIGatewayProxyEventQueryStringParameters,
    } as APIGatewayProxyEvent

    const result = await listCurrencies(event)
    expect(result.statusCode).toBe(200)
    expect(JSON.parse(result.body)).toEqual([])
  })
})
A lot of code will be required to run tests; take a look at the repository and then type:
npm testExtra pipeline
Pipeline GitHub actions with tests, linter (eslint) and checker:
name: build

on:
  push:
    branches: [main]
  pull_request:
    branches: [main]

jobs:
  build:
    runs-on: ubuntu-latest
    defaults:
      run:
        working-directory: 'hello-world'

    steps:
      - uses: actions/checkout@v3
      - uses: pnpm/action-setup@v3
        with:
          version: 8
      - name: Use Node.js ${{ matrix.node-version }}
        uses: actions/setup-node@v3
        with:
          node-version: '18.x'
          cache: 'pnpm'
          cache-dependency-path: ./hello-world/pnpm-lock.yaml

      - name: Install dependencies
        run: pnpm install

      - name: Run ci
        run: npm run test && npm run lint && npm run check
Final Thoughts
In this post, we discussed how to setup our serverless function in the development context, execute and test it before moving it to the production environment, as it should be. So that covers up the first phase; I'll publish a second blog describing how to move our local function into production and deploy it in an AWS environment.
Thank you for your time, and please keep your kernel 🧠 updated to the most recent version. God brings us blessings 🕊️.
Part 2...

Há alguns anos, troquei o conforto da linguagem (C#) e o contexto (Microsoft) com os quais trabalhei por longos anos por um desafio Rails, Elixir e outras linguagens.
Eu estava em busca dessa virada na carreira para agregar outros sabores à minha experiência. Admito que este desafio otimizou a minha forma de pensar e como utilizar as tecnologias disponíveis. Como um usuário Linux de longa data e também um programador de linguagens variadas como C#, Node.js, Java, Python e Rails, eu necessitava desta mudança. Eu passava ao menos 8 horas por dia no Windows trabalhando focado no Visual Studio e um pouco no SQL Server, o que não é ruim, mas na minha opinião eu precisava dessa generalização além da experiência comprovada no meu dia a dia.
Mesmo eu desenvolvendo projetos pessoais com diferentes tecnologias, eu ainda sentia falta dessa experiência diária, de trocar figurinhas e melhorar a cada dia. As inovações de hoje acontecem em uma frequência diferenciada, e não datadas como de costume.
Para se ter uma ideia, atualizações das linguagens de back-end eram de 1 a 3 anos, no front-end, houve demora dos navegadores para implementar a cobertura do ECMAScript 2015 (ES6), havia poucos bancos diferentes, resumidamente esse era a frequência de atualização...
Para você...
Se você sente essa vontade de descobrir algo fora do seu contexto, este artigo é para você que já trabalhou muito com linguagens orientadas à objetos e quer entender um pouco sobre a linguagem funcional Elixir, e por onde começar...
Essa linguagem melhorou a maneira como eu programo. Eu era daqueles programadores que aplicava paradigmas e padrões até no Hello World, sabe? Porque no livro Guru, alguém disse que esta é a única maneira de resolver este problema. Em suma, havia uma certa falta de maturidade.

Minha primeira impressão do Elixir foi incrível, módulos, funções, funções puras, sem efeitos ou surpresas, e também não puras que acessam arquivos, bancos de dados ou serviços.
O que quero ressaltar é que minha primeira exposição ao Elixir foi bem diferente, pois nunca havia trabalhado com linguagens funcionais como Haskell, Erlang, OCaml, Scala, F# e Clojure, apenas tinha visto ou ouvido falar sobre isso 😆.
É claro que para quem já trabalhou com alguma dessas linguagens, que possuem muitos conceitos e princípios a exposição e opinião podem ser diferentes, devemos aplaudir os esforços do Elixir em fornecer uma ampla gama de recursos de linguagem.
A estrutura da linguagem ajuda a manter o código limpo e elegante, além de todos os recursos poderosos do BEAM (Erlang VM), ele suporta o desenvolvimento de grandes aplicações, um exemplo de aplicação em Erlang é nosso querido RabbitMQ muito conhecido por nós desenvolvedores e outro case conhecido por todos nós é o WhatsApp.
Abaixo há uma lista de cases do Elixir:
- Discord
- Heroku
- Pepsico
O que é Elixir?
É uma linguagem de programação funcional de uso geral que roda na Máquina Virtual Erlang (BEAM). Compilando sobre o Erlang, o Elixir fornece aplicativos distribuídos e tolerantes a falhas, que utilizam os recursos de CPU e memória de forma otimizada. Também fornece recursos de meta programação como macros e polimorfismo por protocolos.
Um ponto importante a linguagem foi criada pelo brasileiro 🇧🇷 José Valim.
Elixir tem semelhança sintática ao Ruby e também aproveita recursos como o popular doctest e List Comprehension do Python. Podemos dizer que inspirações trouxeram as melhores práticas de programação para a linguagem.
A linguagem possui tipagem dinâmica, o que significa que todos os tipos são verificados em tempo de execução, assim como o Ruby e JavaScript.
Podemos "tipar" algumas coisas usando Typespecs e Dialyzer para validação de inconsistências, porém isso não interfere na compilação...
Instalando o Elixir
O Elixir possui gerenciador de versões chamado Kiex, mas para rodar o Elixir precisamos de uma máquina virtual Erlang gerenciada pelo Kerl. Muitos instaladores não são uma boa maneira de começar, ok?
Eu recomendo usar o ASDF que tem dois plugins para Elixir e Erlang, e também suporta o arquivo .tools-version onde você especifica qual versão da máquina virtual Erlang sua aplicação está usando (OTP) e qual versão do Elixir.
Escrevi um artigo sobre ASDF + Elixir, então recomendo que você instale a partir deste artigo:
Read Eval Print Loop (REPL)
O melhor lugar para conhecer, aprender e testar uma linguagem é o REPL. Iremos agora testar os conceitos da linguagem antes de adicionar de qualquer tipo de protótipo do projeto.
Tipos de dados
Abaixo temos os tipos de dados existentes no Elixir.
# Inteiros
numero = 1
# Pontos flutuantes
flutuante = 3.14159265358979323846

# Booleanos
verdadeiro = true
falso = false

# Átomos
atom = :sou_atom

# Strings
string = "texto"

# Map
map = %{ "name" => "Foo", "action" => "bar" }
map_atom = %{ name: "Foo", action: :bar }
[map["action"], map_atom.action]
# ["bar", :bar]

# Keyword list
keyword_list = [name: "Bar", action: :foo]
action = keyword_list[:action]

# Lista
list = [1, 2, 3]
Valores Imutáveis
Imutabilidade é recurso também presente em linguagens orientadas como (C# e Java), no Elixir é um recurso é nativo. A programação funcional estabelece que variáveis não podem ser modificadas após sua inicialização, com o simples propósito de evitar efeitos que afetem o resultado, resumidamente fn (1+1) = 2.
Se ocorrer uma nova atribuição de valor, uma nova variável será criada. Resumindo não temos referência para essa variável, vou dar um exemplo de referência usando JavaScript e como seria no Elixir.
No JavaScript...
var messages = ["hello"]

function pushMessageWithEffect(list, message) {
    list.push(message)

    return list
}

function pushMessage(list, message) {
    return list.concat(message)
}

const nextMessage = pushMessage(messages, "world")
console.log(messages, nextMessage)
// [ 'hello' ] [ 'hello', 'world' ]

const nextMessage2 = pushMessageWithEffect(messages, "galaxy")
console.log(messages, nextMessage2)
// [ 'hello', 'galaxy' ] [ 'hello', 'galaxy' ]
No Elixir...
defmodule Messages do
    def push_message(list, message) do
        list ++ [message]
    end
end

messages = ["hello"]
next_message = Messages.push_message(messages, "world")
{ messages, next_message }
# {["hello"], ["hello", "world"]}
No Elixir temos que lidar com módulos e funções, não existem classes então valores não herdam comportamento, como por exemplo em Java cada Objeto recebe um toString() que pode ser sobrescrito para traduzir uma classe em um String, assim como no C# Object.ToString().
Desta forma seria impossível pegar a lista e chamar uma método que a modifique, precisamos gerar uma nova lista para operações em lista e mapas o Elixir possui um módulo Enum que possui muitas implementações como Map, Reduce, filtros, concatenação e outros recursos.
Funções
As funções são responsáveis pelos comportamentos que definem um programa. Essas podem ser puras ou impuras.
Pure Functions (puras)
- Trabalha com valores imutáveis;
- O resultado da função é definido com base nos seus argumentos explícitos, nada de magias 🧙♂️;
- A execução desta função não tem efeito colateral;
Impure Functions (impuras)
Funções impuras podemos definir como complexas, estas podem depender de recursos externos ou executar processos que impactam diretamente no seu resultado, como os exemplos abaixo:
- Escrita em arquivos ou banco de dados;
- Publicação de mensagem em filas;
- Requisições HTTP;
Esses tipos de recursos externos, além de não garantirem que a resposta seja a mesma, também podem apresentar instabilidade, causando erros, algo que uma função pode não esperar, sendo assim um efeito colateral ou "impureza".
Certa vez ouvi em uma apresentação em F# que em C# é comum que nossos métodos (funções) sejam impuros, podendo retornar um resultado do tipo esperado ou simplesmente interromper o fluxo lançando uma exceção. Faz todo o sentido houve um direcionamento dos frameworks, onde começamos a criar exceções relacionadas ao negócio, sendo assim, passamos a usar exceções como desvios de bloco de código, ou seja, o GOTO da estruturada na orientação à objetos 🤦.
Abaixo temos um exemplo prático de uma função de soma pura e soma global que utiliza o módulo Agent para manter o estado o que causará o efeito.
defmodule Functions do
  use Agent

  def start_link(initial_value) do
    Agent.start_link(fn -> initial_value end, name: __MODULE__)
  end

  def state do
    Agent.get(__MODULE__, & &1)
  end

  def update_state(value) do
    Agent.update(__MODULE__, &(&1 + value))
  end

  def sum(x, y) do
    x + y
  end

  def global_sum(x, y) do
    update_state(x + y)
    state()
  end
end

Functions.start_link(0)
# Inicia processo para manter o estado com valor inicial 0

Functions.sum(1, 1)
# 2

Functions.sum(1, 1)
# 2

Functions.global_sum(1, 1)
# 2

Functions.global_sum(2, 3)
# 7
O uso do módulo Agent facilita na clareza de que o método em questão tem efeitos colaterais.
Concorrência, Processos e Tolerância a falhas
Como já foi dito o Elixir lida com processos de forma bem otimizada visando CPU cores, graças também a execução na máquina virtual do Erlang (BEAM).
O Elixir possui uma implementação de processo em segundo plano chamada GenServer/GenStage. Suponha que você queira criar um processo que receba estímulo de uma fila ou um processo agendado que envie uma solicitação HTTP.
Você pode dimensionar o processo para executar (N) GenServer/GenStage, além disso, existe um Supervisor, que é um processo especial que tem uma finalidade de monitorar outros processos.
Esses supervisores permitem criar aplicativos tolerantes a falhas, reiniciando automaticamente processos filhos quando eles falham.
Este tema pode ser considerado o principal do Elixir.
Abaixo está um trecho de código para configurar o supervisor da aplicação de um dos meus projetos em desenvolvimento o BugsChannel.
def start(_type, _args) do
    children =
      [
        {BugsChannel.Cache, []},
        {Bandit, plug: BugsChannel.Api.Router, port: server_port()}
      ] ++
        Applications.Settings.start(database_mode()) ++
        Applications.Sentry.start() ++
        Applications.Gnat.start() ++
        Applications.Channels.start() ++
        Applications.Mongo.start(database_mode()) ++
        Applications.Redis.start(event_target())

    opts = [strategy: :one_for_one, name: BugsChannel.Supervisor]

    Logger.info("🐛 Starting application...")

    Supervisor.start_link(children, opts)
end
Neste caso o supervisor é responsável por vários processos, como filas, bancos de dados e outros processos.
Macros
Há uma afirmação clara na documentação do Elixir sobre macros "As macros só devem ser usadas como último recurso. Lembre-se que explícito é melhor do que implícito. Código claro é melhor do que código conciso." ❤️
Macros podem ser consideradas mágicas 🎩, assim como no RPG, toda magia tem um preço 🎲. Usamos para compartilhar comportamentos, abaixo temos um exemplo básico do que podemos fazer, simulando herança, utilizando um módulo como classe base.
defmodule Publisher do
  defmacro __using__(_opts) do
    quote do
      def send(queue, message) do
        :queue.in(message, queue)
      end

      defoverridable send: 2
    end
  end
end

defmodule Greeter do
  use Publisher

  def send(queue, name) do
    super(queue, "Hello #{name}")
  end
end

queue = :queue.from_list([])

queue = Greeter.send(queue, "world")

:queue.to_list(queue)
# ["Hello world"]
O módulo Publisher define uma função chamada send/2. Esta função é reescrita pelo módulo Greeter para adicionar padrões às mensagens, semelhante às substituições de métodos de classe (overrides).
Para maior clareza, este exemplo podemos implementar sem herança, usando composição do módulo ou apenas o modulo diretamente. Por esta razão, as macros devem ser sempre avaliadas como último recurso.
defmodule Publisher do
  def send(queue, message) do
    :queue.in(message, queue)
  end
end

defmodule Greeter do
  def send(queue, name) do
    Publisher.send(queue, "Hello #{name}")
  end
end

queue = :queue.from_list([])

queue = Greeter.send(queue, "world")

:queue.to_list(queue)
# ["Hello world"]
Além do use, existem outras diretivas definidas pelo Elixir para reuso de funções (alias, import, require), exemplos de uso:
defmodule Math.CrazyMath do
  def sum_pow(x, y), do: (x + y) + (x ** y)
end

defmodule AppAlias do
  alias Math.CrazyMath

  def calc(x, y) do
    "The sum pow is #{CrazyMath.sum_pow(x, y)}"
  end
end

defmodule AppImport do
  import Math.CrazyMath

  def calc(x, y) do
    "The sum pow is #{sum_pow(x, y)}"
  end
end

defmodule AppRequire do
  defmacro calc(x, y) do
    "The sum pow is #{Math.CrazyMath.sum_pow(x, y)}"
  end
end

AppAlias.calc(2, 2)
# "The sum pow is 8"

AppImport.calc(2, 2)
# "The sum pow is 8"

AppRequire.calc(2, 2)
# function AppRequire.calc/2 is undefined or private.
# However, there is a macro with the same name and arity.
# Be sure to require AppRequire if you intend to invoke this macro

require AppRequire
AppRequire.calc(2, 2)
# "The sum pow is 8"
Pattern Matching
A sobrecarga de métodos nas linguagens é relacionada ao número de argumentos e seus tipo de dados, que definem uma assinatura que auxiliam o código compilado a identificar qual método deve ser invocado, já que possuem o mesmo nome porém assinaturas diferentes.
No Elixir há Pattern Matching em todos os lugares, desde a sobrecarga de uma função as condições, esse comportamento da linguagem é sensacional, devemos prestar atenção à estrutura e comportamento.
defmodule Greeter do
  def send_message(%{ "message" => message }), do: do_message(message)

  def send_message(%{ message: message }), do: do_message(message)

  def send_message(message: message), do: do_message(message)

  def send_message(message) when is_binary(message), do: do_message(message)

  def send_message(message), do: "Invalid message #{inspect(message)}"

  def send_hello_message(message) when is_binary(message), do: do_message(message, "hello")

  def do_message(message, prefix \\ nil) do
    if is_nil(prefix),
      do: message,
      else: "#{prefix} #{message}"
  end
end

Greeter.send_message("hello world string")
# "hello world string"
Greeter.send_message(message: "hello keyword list")
# "hello keyword list"
Greeter.send_message(%{ "message" => "hello map", "args" => "ok" })
# "hello map"
Greeter.send_message(%{ message: "hello atom map", args: "ok" })
# "hello atom map"
Greeter.send_hello_message("with prefix")
"hello with prefix"

some_var = {:ok, "success"}
{:ok, message} = some_var
Condicional
Podemos criar condições com estruturas conhecidas como if e case, existe também cond que permite validar múltiplas condições de forma organizada e elegante.
defmodule Greeter do
  def say(:if, name, lang) do
    if lang == "pt" do
      "Olá #{name}"
    else
      if lang == "es" do
        "Hola #{name}"
      else
        if lang == "en" do
          "Hello #{name}"
        else
          "👋"
        end
      end
    end
  end

  def say(:cond, name, lang) do
    cond do
      lang == "pt" -> "Olá #{name}"
      lang == "es" -> "Hola #{name}"
      lang == "en" -> "Hello #{name}"
      true -> "👋"
    end
  end

  def say(:case, name, lang) do
    case lang do
      "pt" -> "Olá #{name}"
      "es" -> "Hola #{name}"
      "en" -> "Hello #{name}"
      _ -> "👋"
    end
  end
end

langs = ["pt", "en", "es", "xx"]

Enum.map(langs, fn lang -> Greeter.say(:if, "world", lang)  end)
# ["Olá world", "Hello world", "Hola world", "👋"]

Enum.map(langs, & Greeter.say(:case, "world", &1))
# ["Olá world", "Hello world", "Hola world", "👋"]

Enum.map(~w(pt en es xx), & Greeter.say(:cond, "world", &1))
# ["Olá world", "Hello world", "Hola world", "👋"]
Aqui estão algumas considerações da implementação para fornecer clareza adicional.
- Podemos perceber que o if não é vantajoso e causa o efeito hadouken, devido a falta do "else if", esse recurso não existe em Elixir e creio que seja proposital, pois temos outras formas de lidar com essas condições, usando case ou cond, ainda há a possibilidade usar guards no case;
- Sigils, presente no Ruby você também pode definir um array desta forma ~w(pt en es xx);
- & &1, forma simplificada de definir uma função anônima e o &1 refere-se a o primeiro argumento dela, neste caso a língua (pt, en, es ou xx);
Função, Função, Função
As estruturas de linguagem são funções e você pode obter o retorno delas da seguinte forma:
input = "123"

result = if is_nil(input), do: 0, else: Integer.parse(input)
# {123, ""}

result2 = if is_binary(result), do: Integer.parse(result)
# nil

result3 = case result do
  {number, _} -> number
  _ -> :error
end

result4 = cond do
  is_atom(result3) -> nil
  true -> :error
end
# :error
A sintaxe de if, case e cond são funções com açúcar sintático, diferentemente do Clojure onde if é uma função e fica bem claro que você está trabalhando com o resultado da função. Na minha opinião prefiro o açúcar sintático, neste caso ele facilita muito a leitura e elegância do código 👔.
Pipe Operator
Para facilitar a compreensão do código quando há um pipeline de execução de função, o pipeline pega o resultado à esquerda e passa para a direita. Incrível! Este recurso deveria existir em todas as linguagens de programação. Há uma proposta de implementação para JavaScript 🤩, quem sabe um dia teremos de forma nativa!
defmodule Math do
  def sum(x, y), do: x + y
  def subtract(x, y), do: x - y
  def multiply(x, y), do: x * y
  def div(x, y), do: x / y
end

x =
  1
  |> Math.sum(2)
  |> Math.subtract(1)
  |> Math.multiply(2)
  |> Math.div(4)

x
# (((1 + 2) -1) * 2) / 4)
# 1
Outros recursos
Concatenação strings
x = "hello"
y = "#{x} world"
z = x <> " world"
# "hello world"

x = nil
"valor de x=#{x}"
# "valor de x="
Guards
São recursos utilizados para melhorar a correspondência de padrões, seja em condições ou funções:
defmodule Blank do
    def blank?(""), do: true
    def blank?(nil), do: true
    def blank?(map) when map_size(map) == 0, do: true
    def blank?(list) when Kernel.length(list) == 0, do: true
    def blank?(_), do: false
end

Enum.map(["", nil, %{}, [], %{foo: :bar}], & Blank.blank?(&1))
# [true, true, true, true, false]

require Logger

case {:info, "log message"} do
  {state, message} when state in ~w(info ok)a -> Logger.info(message)
  {state, message} when state == :warn -> Logger.warning(message)
  {state, message} -> Logger.debug(message)
end

# [info] log message
Erlang
Podemos acessar os recursos Erlang diretamente do Elixir da seguinte forma:
queue = :queue.new()
queue = :queue.in("message", queue)

:queue.peek(queue)
# {:value, "message"}
O Erlang possui um modulo para criação de uma filas em memória (FIFO) o Queue.
Bibliotecas e suporte
Elixir foi lançado em 2012 e é uma linguagem mais recente em comparação com Go, lançado em 2009. Encontramos muitas bibliotecas no repositório de pacotes Hex. O interessante há compatibilidade com pacotes Erlang e existem adaptações de pacotes conhecidos do Erlang para o Elixir.
Um exemplo é Plug.Cowboy, que usa o servidor web Cowboy de Erlang via Plug in Elixir, uma biblioteca para construir aplicativos por meio de funções usando vários servidores web Erlang.
Vale ressaltar que o Erlang é uma linguagem sólida e está no mercado há muito tempo, desde 1986, e o que não existir no Elixir provavelmente encontraremos em Erlang.
Existem contribuições diretas do criador da linguagem o José Valim, de outras empresas e muito trabalho da própria comunidade.
Abaixo temos bibliotecas e frameworks conhecidos no Elixir:
- Phoenix, é um framework de desenvolvimento web escrito em Elixir que implementa o padrão MVC (Model View Controller) do lado do servidor.
- Ecto, ORM do Elixir, um kit de ferramentas para mapeamento de dados e consulta integrada.
- Jason, um analisador e gerador JSON extremamente rápido em Elixir puro.
- Absinthe, A implementação de GraphQL para Elixir.
- Broadway, crie pipelines simultâneos e de processamento de dados de vários estágios com o Elixir.
- Tesla, é um cliente HTTP baseado em Faraday (Ruby);
- Credo, ferramenta de análise de código estático para a linguagem Elixir com foco no ensino e consistência de código.
- Dialyxir, pacote de Mix Tasks para simplificar o uso do Dialyzer em projetos Elixir.
Finalizando...
O objetivo do artigo era preparar um café expresso ☕, porém acabei moendo alguns grãos para extrair o que achei de bom no Elixir, com a intenção de compartilhar e trazer os detalhes a mesa, para quem tem curiosidade e vontade de entender um pouco mais sobre a linguagem e os conceitos de linguagem funcional. Certamente alguns tópicos foram esquecidos, seria impossível falar de Elixir em apenas um artigo 🙃, fica como débito técnico...

Um forte abraço, Deus os abençoe 🕊️ e desejo a todos um Feliz Ano Novo.
Mantenham seu kernel 🧠 atualizado sempre.
Referências
]]>
When we think about legacy systems, we typically think of systems developed in languages like Cobol, Clipper, Pascal, Delphi, Visual Basic, connected to old databases such as Paradox, DB2 and, Firebird.
Nowadays, it's a little different in an organization with multiple languages and projects. For example, Paypal opted to go from Java to Node years ago, and Twitter switched from Ruby to Java. With these examples, we can see that in the legacy context, we are dealing with modern languages, such as Ruby and Java. However, I don't think these developers were driven to change because they favored one language over another.
Refactoring as the solution?
Refactoring is becoming more popular for a particular group of engineers who prefer the hype language over others. I'm not here to pass judgment because I'm wearing this cover 🧙🏾 at a specific point in my career. But I should emphasize that refactoring is never the easiest or best way to solve an issue. As a developer that works with a range of programming languages, You will never find a bulletproof language that works so well for frontend and backend or bff (backend for frontend), that is amazing for mobile, that is lovely and comprehensible for concurrency, that is conformable to test, and so on...
Stop thinking about frameworks and start thinking about how this language will work in your project and ask some questions; the learning curve is good for other members; and consider how other people will solve issues with your produced project. Because if you don't care, you're creating the next legacy system.
Let's get started on a list for creating a stunning legacy system.
1) Languages with limited library support
Before deciding a programming language, evaluate what you plan to develop as a project first, and then whether your stack will be supported by the programming language, for example:
I'd like to create a project involving machine learning or data science. Python, as you may know, is widely used for these reasons and has strong commercial and community support. We may be able to find additional Java or Node libraries, but you will almost certainly have to get your hands dirty translating library behaviors and providing some compatibility.
I'm not arguing that it's completely wrong to use language A or B; you can chose, but you should consider the advantages and downsides. And this decision is sound in the long run when your team chooses to move to another language since there is no support for building quickly, because nowadays you must release fast or your solution design may become deprecated.

2) Use a framework that updates slowly
Nowadays, languages support a wide range of databases, services, and integrations, but occasionally there is limited support, or the community does not generate active updates based on your requirements. That condition is common, for example: NPM, RubyGems and Hex packages without updates for months or years.
Some projects are mature and there is no requirement to update them so frequently, but there comes a specific point when the project is supported by three core committers, each of whom has their own priorities. So, in that case, you must work with these dependencies and collaborate on open-source projects to solve issues or improve security; so, before establishing a framework, list the dependencies as clearly as possible.
Therefore, if open-source efforts exceed commercial efforts, your team may switch from one framework or language to another, introducing legacy systems.

3) Don't think about concurrency or performance.
We commonly hear monolith first and keep it simple, which is a genuine and reliable technique for launching your MVP as soon as possible, but be careful to maintain things simple enough to level up when necessary. I'm not advocating putting reuse ahead of usage, but don't make things too dependent on a framework. Some abstractions with low utilization will allow you to upgrade when "concurrency" comes knocking at your door demand for more performance.

4) Avoid writing tests or maintaining adequate coverage.
Coverage tests are a sensitive topic; I've heard that quantity isn't necessarily better than quality, but less coverage is always worse. You should not write code that lacks appropriate coverage; instead, you should enumerate possible cases to provide coverage; that is every developer's duty. Assume you are a developer for an airline system; is less coverage acceptable? Okay, I took it seriously. But if we get a system with no testing and a bad design we should replace it as quickly as possible.

However, these systems will occasionally live a long time if they work properly and don't interfere with the strong performance of the stack, and the team has no plans to touch these poorly built systems. A system without testing is a good approach to start a legacy system, in my opinion.
5) Write in a new language in the same way you do in previous languages.
It is important to note that approaches and patterns can be used to any language, but you should be aware of the two paradigms commonly used when developing a project, the most well-known of which is Object-Oriented Programming (OOP), and another strong paradigm known as Functional Programming (FP). While OOP emphasizes class management and reusing behaviors, FP tackles modules, functions, and immutability, thus comparing different approaches. I propose using a well-known project's design as a guide when developing your project in a new language, because it's common and comprehensible to write code for a language and then have another person look at it and remark...

To summarize, writing code in a new language is challenging, especially when establishing a new project, but it is a worthwhile experience. If you did your homework and chose this challenge, try to develop small initiatives first; it's not time to rewrite all behaviors that you consider legacy.
Remember that your baby system could become legacy at the same rate that a npm package is released. 😆
6) Write code for yourself rather than for your team.
I believe this happens more frequently than it should. We should not think of of code as abstract art because abstract art is about feelings and is hard to comprehend. Don't let hype influence how you construct your application; the coding should be as straightforward as history.
When coding, try to use well-known and rock-solid methodologies such as SOLID. If you develop a project for yourself, someone will look at it months or years later and say it's too complex, and it's time to retire it and...

A new legacy was born. To replace the legacy system features, a new system will be released.
Final thoughts
In this article, I discuss things to think about while developing a new system with new behaviors or refactoring behaviors from an existing production system. Sometimes a new system is successful, as proved by metrics and team, but other times a redesign works well for a brief amount of time and a new design is required.
To recap, I am not arguing that we should not test hype languages or frameworks, but rather that when you want to bring these new techniques to your team, you should do your homework, ask questions, create proof of concept (PoC), and test metrics to avoid replacing one issue with another.
Thank you for investing your time in reading; God 🕊️ be with you and keep your kernel 🧠 updated, bye.
]]>For a brief period, I changed my configuration to use Optimus Manager instead of Bumblebee because I couldn't get my NVIDIA GPU to work with command optirun. I must admit that this always worked when I used Debian distro bases, but it's not a big deal for me to keep using Debian distros,
I love them as containers or production instances, but not on my desktop, I'm not a big fan of extra apt repositories, after updates some incompatibilities happen and packages may break, for me it's frequent because I'm a developer and I use so many packages 📦.
First, define Bumbleebee.

In the context of GPUs (Graphics Processing Units) and Linux, Bumblebee refers to a project that allows you to use a system's dedicated GPU (typically NVIDIA) for producing graphics while still using the integrated GPU for less demanding tasks. This is especially beneficial in laptops when running applications that do not require the full capabilities of the dedicated GPU.
Bumblebee's principal application is in laptops with dual GPUs, which include an integrated GPU (like Intel's integrated graphics) and a separate GPU (like NVIDIA). Bumblebee enables switching between various GPUs dependent on the application's graphical processing power requirements.
Here's an overview of how Bumblebee works:
- Integrated GPU (for example, Intel): Handles basic rendering and the desktop environment.
- Dedicated GPU (e.g., NVIDIA): Remains in a low-power state until a more graphics-intensive task requires it.
- Optimus Technology (NVIDIA): This is a technology that enables for the seamless switching of integrated and dedicated GPUs depending on the workload.
- Bumblebee: Serves as a bridge between Optimus Technology and the Linux operating system. It enables selected apps to use the dedicated GPU while keeping the rest of the system on the integrated GPU to save power.
It's worth noting that you can use simply NVIDIA while skipping your integrated GPU, but you'll sacrifice battery life for graphical acceleration.
If you purchased a Dell laptop 5 years ago, you may have chosen an Inspiron model with a dedicated GeForce GPU and integrated Intel Graphics. Nowadays, AMD Ryzen with GPU solves your challenges, and you don't require Bumblebee 😭.
Requirements
First, ensure that your Bumblebee service is running and in good health.
sudo systemctl status bumblebeed
● bumblebeed.service - Bumblebee C Daemon
     Loaded: loaded (/usr/lib/systemd/system/bumblebeed.service; enabled; preset: disabled)
     Active: active (running) since ...
You should start the service if it is not already operating.
# checkout logs
journalctl -u bumblebeed

# running service
sudo systemctl start bumblebeed
Using the optirun or primusrun commands
Both optirun and primusrun are commands that work in tandem with the Bumblebee project, which enables dynamic switching between integrated and dedicated GPUs on laptops equipped with NVIDIA Optimus technology. These commands accomplish similar tasks but differ in terms of performance and how they handle the rendering process.
- optirun: This Bumblebee project command is used to run a program with the dedicated GPU. It employs VirtualGL as a bridge, rendering graphics on the dedicated GPU before sending the output to the integrated GPU for display. The disadvantage is that the method includes duplicating frames between GPUs, which can increase overhead and degrade speed. Wine and Crossover, for example, may not work correctly in this way.
- primusrus: This command is part of the Bumblebee project as well, but it takes a different approach. It employs Primus as a VirtualGL backend in order to reduce the overhead involved with copying frames between GPUs. When compared to optirun, Primus seeks to improve performance by providing a more efficient approach to handle the rendering process, resulting in higher frame rates for GPU-intensive applications. Improved support for Wine and Crossover apps.
The file /etc/bumblebee/xorg.conf.nvidia that follows is an exact representation of the default settings generated by your Linux distribution, in this instance Manjaro Hardware Detection (mhwd).
##
## Generated by mhwd - Manjaro Hardware Detection
##

Section "ServerLayout"
    Identifier "Layout0"
    Option "AutoAddDevices" "false"
EndSection

Section "ServerFlags"
  Option "IgnoreABI" "1"
EndSection

Section "Device"
    Identifier  "Device1"
    Driver      "nvidia"
    VendorName "NVIDIA Corporation"
    Option "NoLogo" "true"
    Option "UseEDID" "false"
    Option "ConnectedMonitor" "DFP"
EndSection
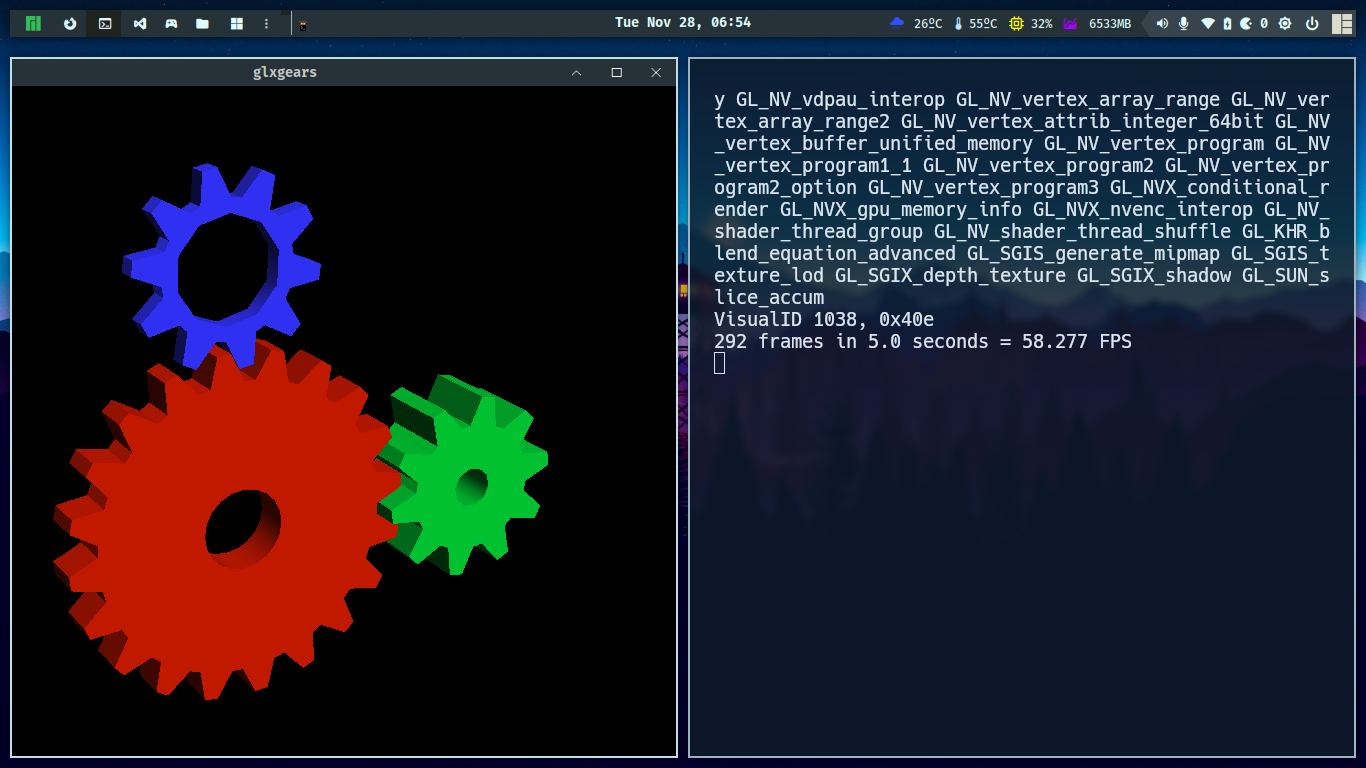
Before performing the testing command, install glxgears from the mesa-utils package:
# manjaro pamac
sudo pamac install mesa-utils

# with pacman
sudo pacman -S mesa-utils
For tackling the issue, let us run primusrun and optirun with an application to test the graphics card.
optirun glxgears --info

primusrun glxgears --info
The result should be an issue bellow:
- Optirun
[ 9`634.005329] [ERROR]Cannot access secondary GPU - error: [XORG] (EE) No devices detected.

[ 9634.005368] [ERROR]Aborting because fallback start is disabled.
- Primusrun
primus: fatal: Bumblebee daemon reported: error: [XORG] (EE) No devices detected.
This problem occurred because the NVIDA configuration did not include the required BusID device for the dedicated GPU.
The command below will return your BusID devices.
lspci
The result:
08:00.0 3D controller: NVIDIA Corporation GK208BM [GeForce 920M] (rev a1)
08:00.1 Audio device: NVIDIA Corporation GK208 HDMI/DP Audio Controller (rev a1)
In this scenario, 08:00.0 is the BusID device for my NVIDIA dedicated GPU. So, in the configuration file /etc/bumblebee/xorg.conf.nvidia, specify this reference at section device (BusID "PCI:08:00:0"):
⚡ Please replace the dot with a colon in the suffix BusID. From PCI:08:00.0 to PCI:08:00:0
sudo nano /etc/bumblebee/xorg.conf.nvidia
##
## Generated by mhwd - Manjaro Hardware Detection
##


Section "ServerLayout"
    Identifier "Layout0"
    Option "AutoAddDevices" "false"
EndSection

Section "ServerFlags"
  Option "IgnoreABI" "1"
EndSection

Section "Device"
    Identifier  "Device1"
    Driver      "nvidia"
    VendorName "NVIDIA Corporation"
    Option "NoLogo" "true"
    Option "UseEDID" "false"
    Option "ConnectedMonitor" "DFP"
    BusID "PCI:08:00:0"
EndSection
We can now execute commands without trouble.
optirun glxgears --info

primusrun glxgears --info
Final thoughts
Today's article addresses a typical problem that happens after installing Manjaro if you have multiple Graphic Cards and use Bumblebee to manage them. Arch distributors may be aware of this issue. Thank you for reading. I hope this article helped you solve your problem and that you enjoy your games.
God bless 🕊️ your day and your kernel 🧠, and I hope to see you soon.
References
]]>A few weeks ago, I decided to switch from my latest desktop (Bugdie) to window managers. During my early experiences with Conectiva, Mandrake, and Slackware, I used Blackbox and thought it was fantastic, but I didn't know how to configure things at the time.
So I went back to KDE after trying GNOME, Deepin, Pantheon, XFCE and Bugdie. I became a distro Hopper 🕵️, looking into Desktop and enjoying and hating desktop behaviors. I never found a desktop that was comfy for me.
Why am I here using AwesomeWM rather than I3, BSPWM, XMonad, and other options? I haven't tried any of them yet, but the default theme and menu are similar to the old Blackbox and Fluxbox, and I'm not a Lua highlander developer 🔥, but the language is too simple, and in a few weeks I discovered various references at Git and significant AwesomeWM instructions, for developing my own dotfiles and widgets.
Before diving into AwesomeWM, let's take a quick look at Window Managers.
Window Manager
Is a software component that handles the placement and appearance of windows in an operating system's graphical user interface (GUI). It is in charge of managing the graphical elements on the screen, such as windows, icons, and other graphical elements, and it allows the user to interact with these items.
There are various types of window managers, which can be essentially divided into two categories:
Stacking Window Managers: These allow windows to overlap and allow the user to bring any window to the foreground by clicking on it: Blackbox, Openbox, Fluxbox and Window Maker are examples of stacking window managers
Tiling Window Managers: Tiling window managers organize windows so that they do not overlap. They tile windows to fill the available screen space automatically, which can be more efficient for certain tasks. Instead of using a mouse, users often browse between windows using keyboard shortcuts: I3, Awesome, BSPWM, DWM, XMonad, QTile and Hyprland are examples of tiling window managers.
It's important to note that tiling manager features arrive to come, so desktops as GNOME and KDE introduced tiling features.
AwesomeWM
Awesome Window Manager is a highly customizable, dynamic tiling window manager for the X Window System (the windowing system used by Linux and other Unix-like operating systems). It is intended to be incredibly versatile and adaptable, giving users complete control over the layout and appearance of their desktop environment.
You can do everything you want with done widgets or by yourself with Lua development. I admit that I mixed the two. Creating something from scratch requires too much of you, and you can grow bored fixing and running it for too long, therefore I decided to base my theme on CopyCats. Because there are so many specifications involved in an environment, such as network, CPU, RAM, Graphic Card, Sound Card, Microphone, and so on, certain things may not work at first or with default settings.
CopyCats is a collection of themes on which you can tweak or build your own.
Template file
AwesomeWM has a file called rc.lua that contains all of the rules, behaviors, and styles for windows. This file contains comments that separate the template settings into sections.
The file is located by default at /etc/xdg/awesome/rc.lua, and you must copy it to your home location to make your changes.
sudo cp /etc/xdg/awesome/rc.lua $HOME/.config/awesome/00.rc.lua
I have no intention of describing a full template, but I will highlight key areas to demonstrate how AwesomeWM works.
Menu
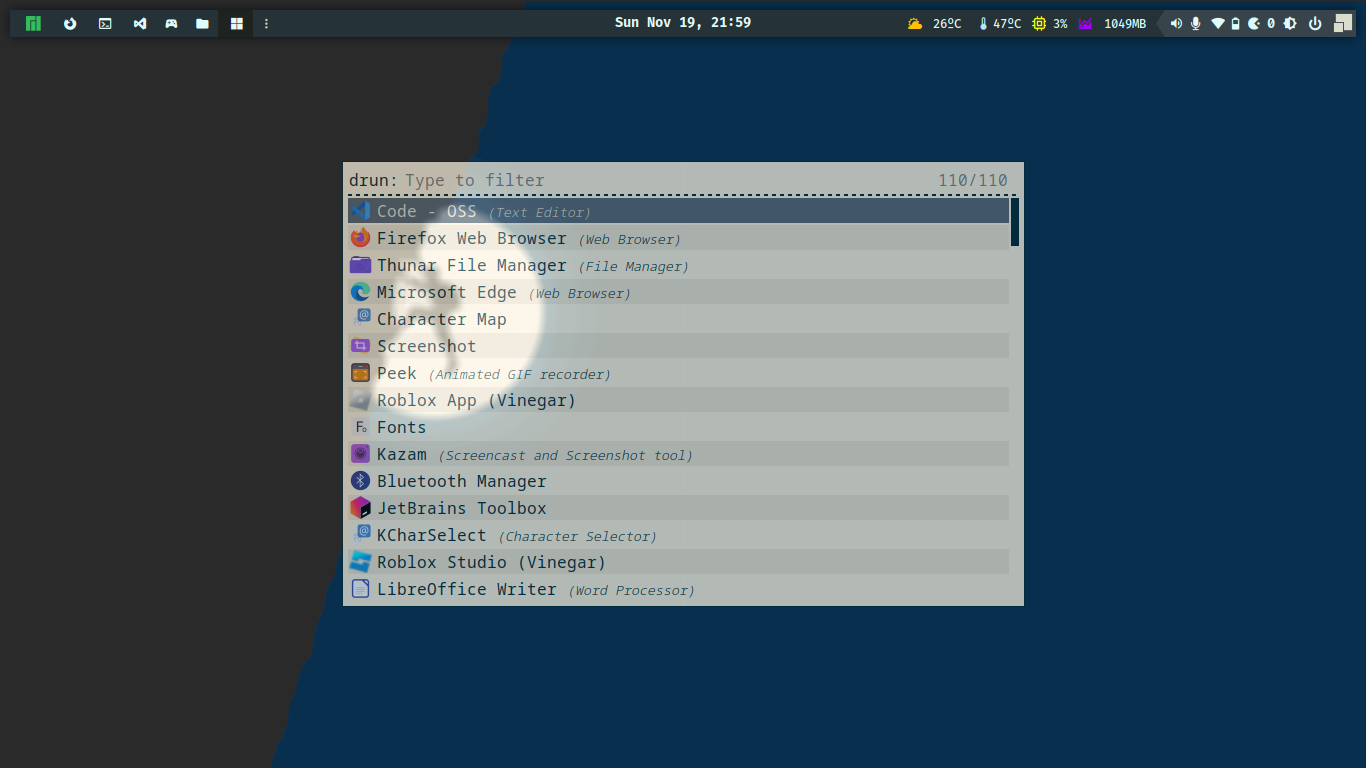
You can attach instructions or functions to a menu or sub-menu, but keep in mind that you can use launcher to execute your apps, of which I choose Rofi.
-- {{{ Menu
-- Create a launcher widget and a main menu
myawesomemenu = {
   { "hotkeys", function() hotkeys_popup.show_help(nil, awful.screen.focused()) end },
   { "manual", terminal .. " -e man awesome" },
   { "edit config", editor_cmd .. " " .. awesome.conffile },
   { "restart", awesome.restart },
   { "quit", function() awesome.quit() end },
}
Tags (environments)
You can have as many environments as you desire, and you can access them with the (⊞ window key + arrows) shortcut.
screen.connect_signal("request::desktop_decoration", function(s)
    -- Each screen has its own tag table.
    awful.tag({ "1", "2", "3", "4", "5", "6", "7", "8", "9" }, s, awful.layout.layouts[1])
end)
Keybindings
You can define or edit any keybinding. The shortcut (⊞ window key + s) displays guidelines for all shortcuts defined in your template, which is very useful.
awful.keyboard.append_global_keybindings({
    awful.key({ modkey,           }, "s",      hotkeys_popup.show_help,
              {description="show help", group="awesome"})
})
Bars
Wibar is highly adaptable; you may specify a widget or group, as well as determine alignment, spacing, and margins. I tried using Polybar at first, but I didn't like the outcome. However, if you want to switch to another Window Manager, Polybar works in the majority of them.
s.mywibox = awful.wibar {
position = "top",
screen   = s,
widget   = {
    layout = wibox.layout.align.horizontal,
    { -- Left widgets
        layout = wibox.layout.fixed.horizontal,
        mylauncher,
        s.mytaglist,
        s.mypromptbox,
    },
    s.mytasklist, -- Middle widget
    { -- Right widgets
        layout = wibox.layout.fixed.horizontal,
        mykeyboardlayout,
        wibox.widget.systray(),
        mytextclock,
        s.mylayoutbox,
    },
}
Now we'll look at templates. I don't recommend employing templates as your final work; instead, separate them into numerous files. Divide and conquer is usually a good method for organizing and keeping your code as professional as possible. Everything in the template is grouped together on purpose to present all settings in a single file; this file is a dump.
Compositor
In the same way that XFCE utilizes compiz to add blur, transparency, and graphical effects to windows, we must use picom to add cosmetic features to Awesome WM.
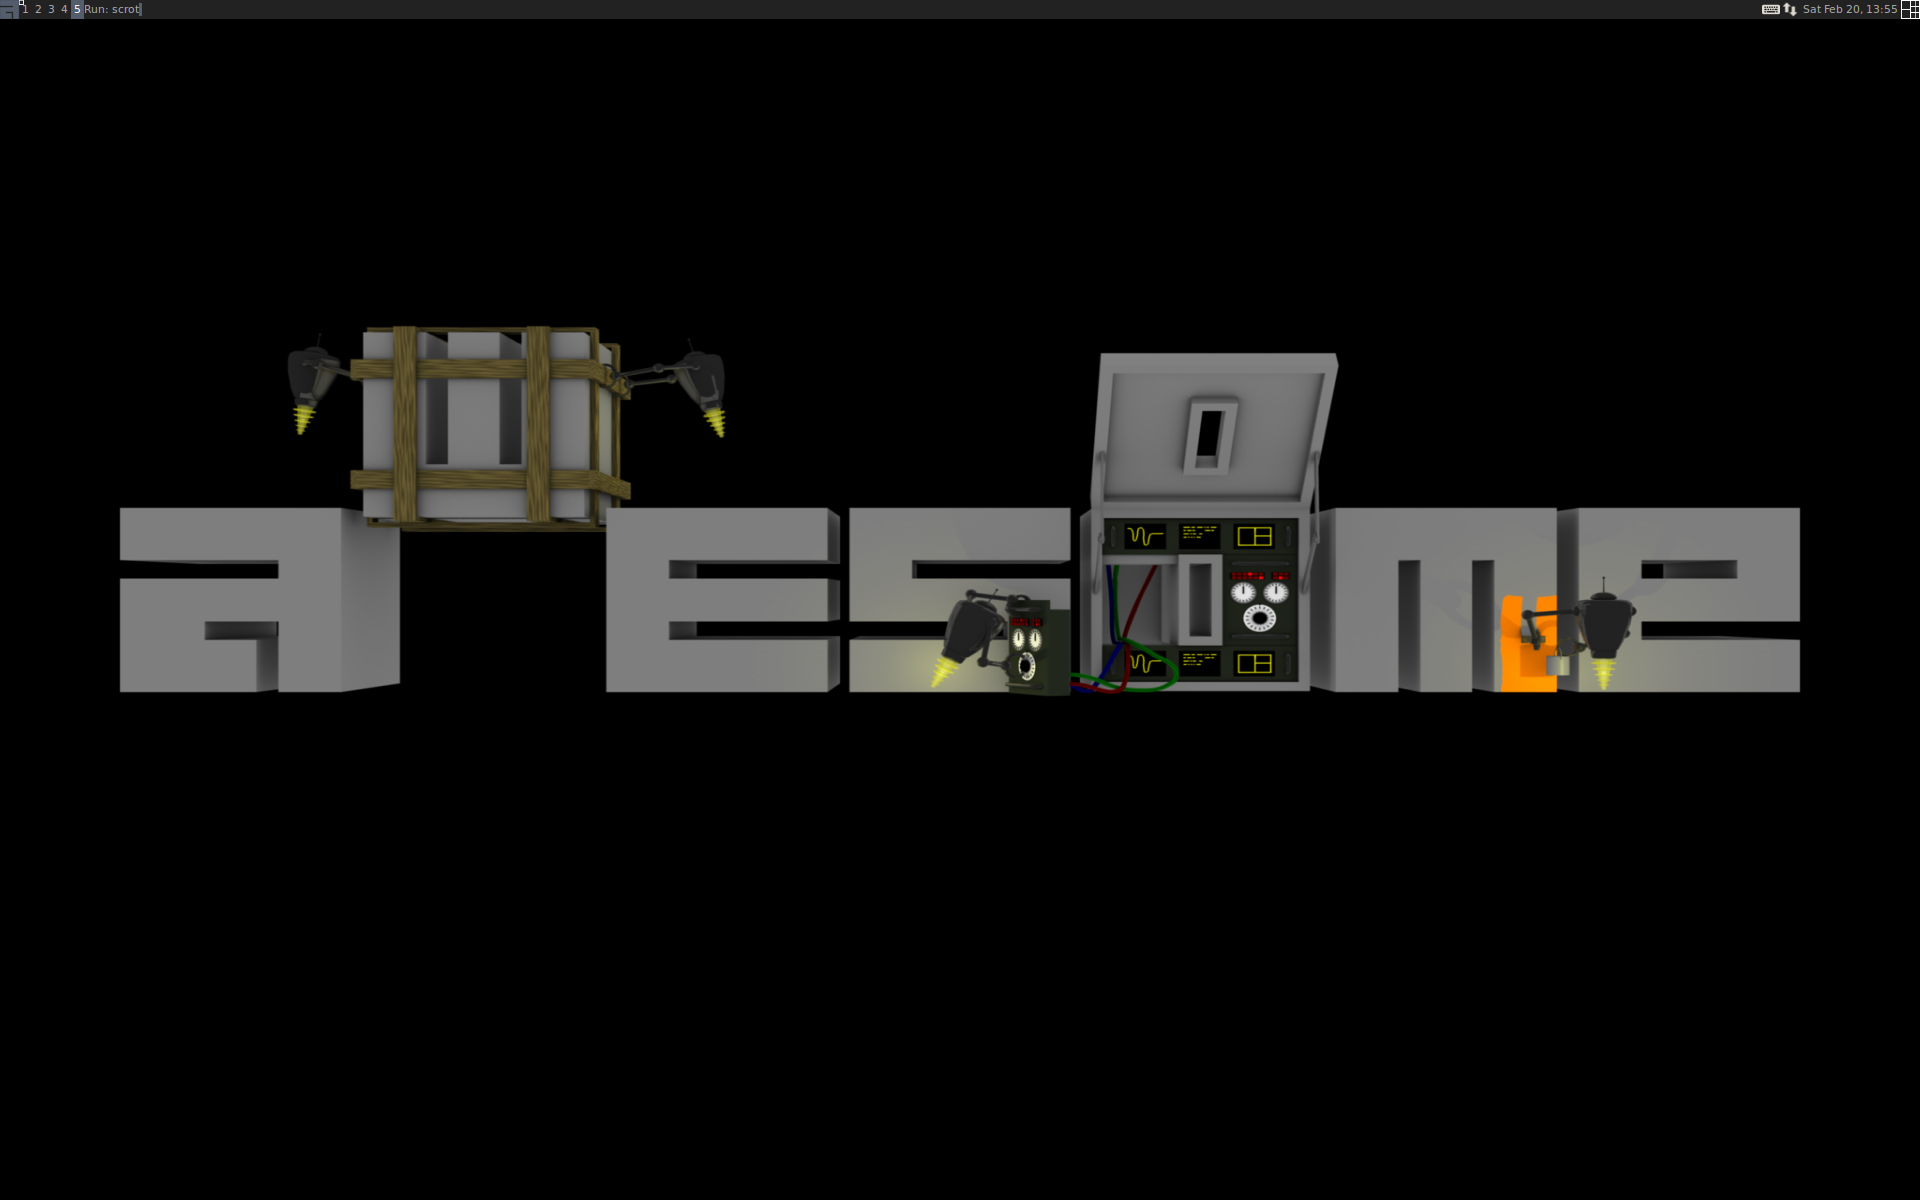
My Awesome WM theme
After weeks of working in this environment, I created something I enjoyed; there is still more work to be done, but I'm happy with my shortcuts and environment feedback. My son accompanied me on this journey and was continuously saying to me, "let me see your little top bar" or "barrinha" in Portuguese.
This theme was named Ebenezer 🪨, which meaning "stone of helper.".
The quote is from I Samuel 7. After defeating the Philistines, Samuel raises his Ebenezer, declaring that God defeated the enemies on this spot. As a result, "hither by thy help I come." So I hope this stone helps you in your environment and, more importantly, in your life. 🙏🏿
Of course, this top-bar is inspired by others, but I keep what's really important to me to monitor and track, memory, temperature, and CPU, and when something exceeds the indicators colors change, similar to our dashboards at developer context. The battery exhibits the same expected behavior.

I appreciate the idea of keybindings, but for some tasks, I utilize mouse behaviors, such as microphone muting, opening wifi-manager, and tool tips that provide useful information such as wifi signal, current brightness, and battery state.
Following that, I'll explain what this implementation does, and you can clone it if you like; this theme is incredibly adaptable. I'm attempting to keep everything changeable via ini files, therefore there's a file called config.ini where you can customize style and behaviors.
The config.ini
[environment]
modkey=Mod4
weather_api_key=api_weather_key # openweathermap.org
city_id=your_city_id # openweathermap.org
logo=$THEMES/icons/tux.png
logo_icon=
logo_icon_color=#34be5b
wallpaper_slideshow=on # [off] wallpaper solo
wallpaper=$HOME/Pictures/Wallpapers/active.jpg # wallpaper solo
wallpaper_dir=$HOME/Pictures/Wallpapers # when wallpaper_slideshow=on you should inform wallpapers directory
terminal=kitty
editor=nano
icon_theme="Papirus"
icon_widget_with=22
[commands]
lock_screen=~/.config/i3lock/run.sh
brightness_level=light -G
brightness_level_up=xbacklight -inc 10
brightness_level_down=xbacklight -dec 10
power_manager=xfce4-power-manager --no-daemon
network_manager=nm-connection-editor
cpu_thermal=bash -c "sensors | sed -rn \"s/.*Core 0:\\s+.([0-9]+).*/\1/p\""
click_logo=manjaro-settings-manager
volume_level=pactl list sinks | grep '^[[:space:]]Volume:' | head -n $(( $SINK + 1 )) | tail -n 1 | sed -e 's,.* \([0-9][0-9]*\)%.*,\1,'
[wm_class]
browsers=firefox chromium-browser microsoft-edge
editors=code-oss sublime atom
[tags]
list=
browsers=1
terminal=2
editors=3
games=4
files=5
others=6
[topbar]
left_widgets=tag_list separator task_list
right_widgets=weather cpu_temp cpu mem arrow arrow_volume arrow_microphone arrow_network arrow_battery arrow_systray arrow_pacman arrow_brightness arrow_logout arrow_layoutbox
[startup]
picom=picom --config $THEMES/picom.conf
lock_screen=light-locker --lock-after-screensaver=10 &
desktop_policies=lxpolkit # default file polices (open files from browser)
multiple_screen=exec ~/.config/xrandr/startup.sh "1366x768" # type xrandr to check supported mode
mouse_reset=unclutter
[fonts]
font=Fira Code Nerd Font Bold 10
font_regular=Fira Code Nerd Font Medium 9
font_light=Fira Code Nerd Font Light 10
font_strong=Fira Code Nerd Font 12
font_strong_bold=Inter Bold 12
font_icon=Fira Code Nerd Font 11
[colors]
fg_normal=#e0fbfc
fg_focus=#C4C7C5
fg_urgent=#CC9393
bg_normal=#263238
bg_focus=#1E2320
bg_urgent=#424242
bg_systray=#e0fbfc
bg_selected=#5c6b73
fg_blue=#304FFE
fg_ligth_blue=#B3E5FC
fg_yellow=#FFFF00
fg_red=#D50000
fg_orange=#FFC107
fg_purple=#AA00FF
fg_purple2=#6200EA
fg_green=#4BC1CC
bg_topbar=#253237
bg_topbar_arrow=#5c6b73
border_color_normal=#9db4c0
border_color_active=#c2dfe3
border_color_marked=#CC9393
titlebar_bg_focus=#263238
titlebar_bg_normal=#253238
As you can see, there are numerous settings, however I must admit that there are numerous items to include in this file.
Features
Changing the wallpaper when using the slide show mode
Screenshot desktop, window, delayed and area
The screenshot default place is $HOME/Pictures/Screenshots

Notifications feedback's

Launcher (rofi)
Lock screen (i3lock)

Tooltip

Terminal
🎮 Not only a coder, but also a daddy developer, I was playing Roblox with my son while Wine Vinegar consuming and harming my CPU.

Features development
Some features were created from scratch, while others were discovered on Github and changed to my way and style.
If you feel the same way I do, where KDE, GNOME, Mate, XFCE, Cinnamon are too much for you, go with Awesome WM, which is my dotfiles:
williampsenaThat's all folks
In this piece, I'll explain how Awesome WM works and give some useful dotfiles. As a developer, I hope you find this material valuable on a daily basis.
I'll see you again soon, and please keep your kernel 🧠 up to date and God bless 🙏🏿 you.
]]>Graceful shutdown is a process that is well stated in twelve factors; in addition to keeping applications with 🏁 fast and furious launch, we need be concerned with how we dispose of every application component. We're not talking about classes and garbage collector. This topic is about the interruption, which could be caused by a user stopping a program or a container receiving a signal to stop for a scaling operation, swapping from another node, or other things that happen on a regular basis while working with containers.
Imagine an application receiving requests for transaction payments and an interruption occurs; this transaction becomes lost or incomplete, and if retry processing or reconciliation is not implemented, someone will need to push a button to recover this transaction...

We should agree that manual processing works at first, but every developer knows the end...
How does graceful shutdown work?
When your application begins to dispose, you can stop receiving more demands; these demands could be a message from a queue or topic; if we're dealing with workers, this message should return to the queue or topic; Rabbit provides a message confirmation (ACK) that performs a delete message from the queue that is successfully processed by the worker. In container contexts, this action should be quick to avoid a forced interruption caused by a long waiting time.
Show me the code!
You may get the source code from my Github repository.
The following code shows a basic application that uses signals to display Dragon Ball 🐲 character information every second. When interruption signal is received the timer responsible to print messages per second is stopped. In this example, we're using simple timers, but it could also be a web server or a worker connected into a queue, as previously said. Many frameworks and components include behaviors for closing and waiting for incoming demands.
- app.go
package main

import (
	"encoding/csv"
	"fmt"
	"math/rand"
	"os"
	"os/signal"
	"syscall"
	"time"
)

const blackColor string = "\033[1;30m%s\033[0m"

var colors = []string{
	"\033[1;31m%s\033[0m",
	"\033[1;32m%s\033[0m",
	"\033[1;33m%s\033[0m",
	"\033[1;34m%s\033[0m",
	"\033[1;35m%s\033[0m",
	"\033[1;36m%s\033[0m",
}

type Character struct {
	Name        string
	Description string
}

func main() {
	printHello()

	sigs := make(chan os.Signal, 1)
	signal.Notify(sigs, syscall.SIGINT, syscall.SIGTERM)

	fmt.Println("Starting random Dragon Ball characters service...")

	shutdown := make(chan bool, 1)

	go func() {
		sig := <-sigs
		fmt.Println()
		fmt.Println(sig)
		shutdown <- true
	}()

	characterSize, characterList := readFile()

	quit := make(chan struct{})

	go func() {
		ticker := time.NewTicker(5 * time.Second)
		for {

			select {
			case <-ticker.C:
				printMessage(characterSize, characterList)
			case <-quit:
				ticker.Stop()
				return
			}
		}
	}()

	<-shutdown

	close(quit)

	fmt.Println("Process gracefully stopped.")
}

func printHello() {
	dat, err := os.ReadFile("ascii_art.txt")

	if err != nil {
		panic(err)
	}

	fmt.Println(string(dat))
}

func readFile() (int, []Character) {
	file, err := os.Open("dragon_ball.csv")

	if err != nil {
		panic(err)
	}

	csvReader := csv.NewReader(file)
	data, err := csvReader.ReadAll()

	if err != nil {
		panic(err)
	}

	characterList := buildCharacterList(data)

	file.Close()

	return len(characterList), characterList
}

func buildCharacterList(data [][]string) []Character {
	var characterList []Character

	for row, line := range data {
		if row == 0 {
			continue
		}

		var character Character

		for col, field := range line {
			if col == 0 {
				character.Name = field
			} else if col == 1 {
				character.Description = field
			}
		}

		characterList = append(characterList, character)
	}

	return characterList
}

func printMessage(characterSize int, characterList []Character) {
	color := colors[rand.Intn(len(colors))]
	characterIndex := rand.Intn(characterSize)
	character := characterList[characterIndex]

	fmt.Printf(color, fmt.Sprintf("%s %s", "🐉", character.Name))
	fmt.Printf(blackColor, fmt.Sprintf(" %s\n", character.Description))
}
- go.mod
module app

go 1.20
Code Highlights
- This code block prepares the application to support signals; shutdown is a channel that, when modified, triggers an execution block for disposal.
	sigs := make(chan os.Signal, 1)
	signal.Notify(sigs, syscall.SIGINT, syscall.SIGTERM)

	shutdown := make(chan bool, 1)

	go func() {
		sig := <-sigs
		fmt.Println()
		fmt.Println(sig)
		shutdown <- true
	}()
- The ticker is in charge of printing messages every 5 seconds; when it receives a signal from the quit channel, it stops.
quit := make(chan struct{})

go func() {
    ticker := time.NewTicker(5 * time.Second)
    for {

        select {
        case <-ticker.C:
            printMessage(characterSize, characterList)
        case <-quit:
            ticker.Stop()
            return
        }
    }
}()
- The ticker is closed by "quit channel" after receiving a signal halting the application's execution.
<-shutdown

	close(quit)

	fmt.Println("Process gracefully stopped.")
Graceful Shutdown working
When CTRL+C is pressed, the application receives the signal SIGINT, and disposal occurs, the following command will launch the application.
go run app.go
Containers
It's time to look at graceful shutdown in the container context; in the following file, we have a container image:
- Containerfile
FROM docker.io/golang:alpine3.17

MAINTAINER [email protected]

WORKDIR /app

COPY ./graceful_shutdown go.mod /app

RUN go build -o /app/graceful-shutdown

EXPOSE 3000

CMD [ "/app/graceful-shutdown" ]
Let's build a container image:
docker buildx build -t graceful-shutdown -f graceful_shutdown/Containerfile .

# without buildx
docker build -t graceful-shutdown -f graceful_shutdown/Containerfile .

# for podmans
podman build -t graceful-shutdown -f graceful_shutdown/Containerfile .
The following command will test the execution, logs, and stop that is in charge of sending signals to the application; if no signals are received, Docker will wait a few seconds and force an interruption:
docker run --name graceful-shutdown -d -it --rm graceful-shutdown
docker logs -f graceful-shutdown

# sent signal to application stop
docker stop graceful-shutdown

# Using
# Podman

podman run --name graceful-shutdown -d -it --rm graceful-shutdown
podman logs -f graceful-shutdown

# sent signal to application stop
podman stop graceful-shutdown
That's all folks
In this article, I described how graceful shutdown works and how you may apply it in your applications. Implementing graceful shutdown is part of a robust process; we should also examine how to reconcile a processing when a server, node, or network fails, so we should stop thinking just on the happy path.
I hope this information is useful to you on a daily basis as a developer.
I'll see you next time, and please keep your kernel 🧠 updated.
References
]]>Anos atrás, eu estava entre o NPM e o Yarn, uma questão comum entre desenvolvedores Node.js. Eu sempre mantive ambos instalados e depois de uma melhoria de performance no NPM, o Yarn virou plano B, "se o NPM falhar bora de Yarn".
Em busca de conhecimento 👽, encontrei o PNPM há algum tempo e resolvi testá-lo. Notei uma melhoria gigante na instalação de pacotes e o mais interessante é que essa estratégia aprimorada de reuso de pacotes do projeto, reduz o espaço em disco consumido pelos pacotes.
PNPM
É um gerenciador de pacotes que lida com instalação, atualização e remoção de pacotes. Esses pacotes contêm principalmente JavaScript/Typescript e assets utilizados por seus diversos bundlers. Assim como Yarn o registry NPM é usado pelo PNPM.
Melhorias
Redução no tempo de instalação e tamanhos dos pacotes são pontos positivos do PNPM, essas características ajudam e muito, desde a criação de imagens de container até o ambiente de desenvolvimento.
Hoje em dia instalamos um pacote NPM que instala uma dependência que tem outra dependência e você acaba colocando tanta coisa no seu projeto que só percebe no seu lock file.

Por que o PNPM?
Não estou dizendo que devemos parar de usar Yarn ou NPM, ambos funcionam, mas quando há aqueles projetos com vários pacotes e usando um bundler com diversas dependências enraizadas e comuns...
Podemos dizer que com o PNPM, seus problemas acabaram e eu agarantio...

Quem utiliza o PNPM?
O projeto é bem maduro e utilizado por grandes empresas.

Instalando PNPM
Bora vamos instalar o PNPM, existem vários métodos disponíveis, como em todo ambiente Node.js, o NPM já está instalado, podemos instalá-lo através dele assim como o Yarn ou uma instalação desvinculada.
# powershell (windows)
iwr https://get.pnpm.io/install.ps1 -useb | iex

# using curl
curl -fsSL https://get.pnpm.io/install.sh | sh -

# using wget
wget -qO- https://get.pnpm.io/install.sh | sh -

# using npm
npm install -g pnpm
Testes
Abaixo iremos testar a instalação da biblioteca React e suas dependências:
mkdir /tmp/pnpm-test
cd /tmp/pnpm-test
npm init -y foo bar

pnpm install react @testing-library/react @testing-library/jest-dom
O comando abaixo lista links simbólicos, ou seja, uma forma de validar o reuso de pacotes no projeto.
ls -lhaF node_modules | grep ^l
As bibliotecas usadas tem o React como um pacote comum, que será reutilizado, o que é uma das estratégias do PNPM para tornar o processo de instalação mais rápido e reduzindo o uso do armazenamento, conforme mencionado anteriormente, os pacotes serão armazenados uma única vez, abaixo temos uma referência de link simbólico para node_modules/react.
.pnpm/[email protected]/node_modules/react/
Não que eu goste de projetos que compartilham uma lista enorme de dependências, mas os benefícios são ainda maiores com o PNPM.
Performance
O site oficial do PNPM fornece benchmarks entre gerenciadores de pacotes, recursos e tempos de execução.

Compatibilidade
O PNPM é compatível com o Node.js desde a versão 16x, hoje estamos na versão 18x como LTS, segue abaixo uma tabela de compatibilidade considerando a versão LTS como partida.
| Node.js | pnpm 5 | pnpm 6 | pnpm 7 | pnpm 8 |
|---|---|---|---|---|
| 18 | ? | ✅ | ✅ | ✅ |
| 20 | ? | ? | ✅ | ✅ |
Recursos
Esta lista de recursos e comparação foram retiradas do site oficial.
| Feature | pnpm | Yarn | npm |
|---|---|---|---|
| Workspace support | ✔️ | ✔️ | ✔️ |
Isolated node_modules |
✔️ - The default | ✔️ | ✔️ |
Hoisted node_modules |
✔️ | ✔️ | ✔️ - The default |
| Autoinstalling peers | ✔️ | ❌ | ✔️ |
| Plug'n'Play | ✔️ | ✔️ - The default | ❌ |
| Zero-Installs | ❌ | ✔️ | ❌ |
| Patching dependencies | ✔️ | ✔️ | ❌ |
| Managing Node.js versions | ✔️ | ❌ | ❌ |
| Has a lockfile | ✔️ - pnpm-lock.yaml |
✔️ - yarn.lock |
✔️ - package-lock.json |
| Overrides support | ✔️ | ✔️ - Via resolutions | ✔️ |
| Content-addressable storage | ✔️ | ❌ | ❌ |
| Dynamic package execution | ✔️ - Via pnpm dlx |
✔️ - Via yarn dlx |
✔️ - Via npx |
| Side-effects cache | ✔️ | ❌ | ❌ |
| Listing licenses | ✔️ - Via pnpm licenses list |
✔️ - Via a plugin | ❌ |
Principais comandos
| pnpm | npm | yarn |
|---|---|---|
| pnpm install | npm install | yarn install |
| pnpm install react | npm install react | yarn add react |
| pnpm uninstall react | npm uninstall react | yarn remove react |
| pnpm store prune | npm cache clean --force | yarn cache clean |
Maiores informações na documentação oficial.
Fim!
O objetivo deste artigo foi demonstrar uma opção rápida de gerenciar seus pacotes, estejam eles instalados em seu ambiente de desenvolvimento ou em seu container. Outra vantagem é que o lock file PNPM possui sintaxe yaml, o que torna o arquivo mais fácil de ler em minha humilde opinião.
Deus abenç️️oe 🕊️ uma excelente semana para você! ️
Mantenha seu kernel 🧠 atualizado.
Referências
]]>I was chatting to my brother about Kong, cluster, deployment, and how to extract metrics a few days ago. Then I'm here to show you how to use Grafana and Prometheus to collect metrics from Kong API Gateway. Metrics are a good approach to get some data to detect bottlenecks and make improvements to your stack.
Kong
If you are unfamiliar with Kong API Gateway, I recommend reading my prior article:

Kong an API Gateway is built on NGINX and allows plugins through the Lua module; however, custom plugins can now use Python, Go, and Javascript.
Kong offers two editions: community and enterprise. Private plugins, dashboard, admin, and hosting plans are available with the Enterprise edition. We must address this hole in the Community edition with Open Source Solutions; if you need a UI admin, Konga is a possibility, and you can discover some Kong plugins if the core plugins do not support your solution.
Grafana
Observability has never been more essential than right now. When working with clusters, instances with varying specs, containers, and programming languages. Analyzing metrics and displaying them in dashboards is the best way to determine what works for our stack.
Grafana is an open source analytics and monitoring tool that lets us send measurements from a wide range of data sources, including Prometheus, InfluxDB, PostgreSQL, MySQL, MSSQL, Azure Monitor, Google Cloud Monitoring, AWS CloudWatch, ElasticSearch, and others.
The most essential aspect of all metrics configuration is that we may establish alerts for Application or Business metrics:
Business
- How many payments did we receive per minute?
- How many orders are canceled per day?
- How many claims are made every hour?
Application
- How many RPS (Request per Second) do we have?
- How much CPU and RAM does the application require?
- How many messages are waiting to be processed in our queue?
- What about the http status of services?
With these statistics, we may say, "Good game, my bro!"

Prometheus
Prometheus is open source software that was created by SoundCloud in 2012. After Kubernetes, the Cloud Native Computing Foundation selected Prometheus as its second incubated project in May 2016.
The software supports event monitoring and alerting, however it lacks Grafana's excellent dashes and full-featured UI.
The example
This time, we'll build an API Gateway that supports both external APIs for retrieving values from (money and coins) and local APIs for demonstrate how Kong load balancing works with upstreams and self-healing (health-checks).
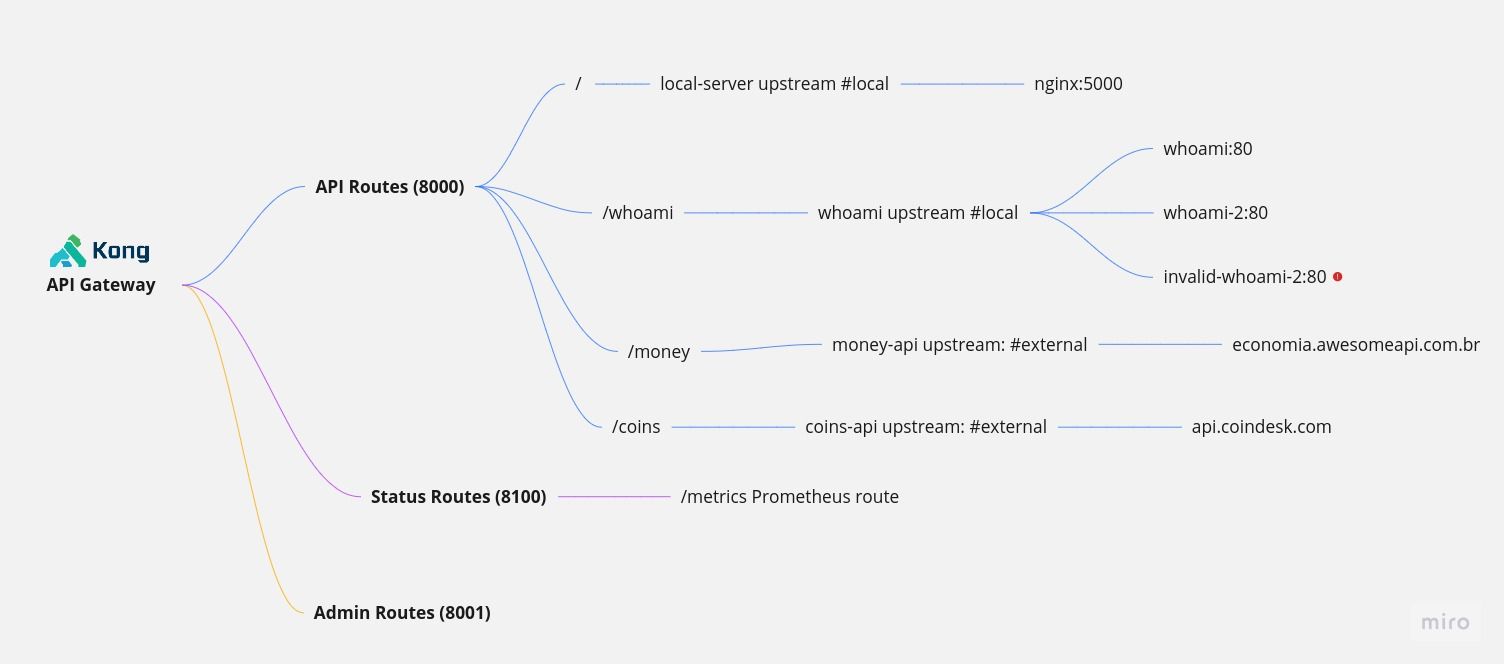
- api routes, by default, Kong listens on port 8000 for established API routes.
- admin routes, Kong allows us to handle routes, services, and plugins on port 8001, but some features will only operate in database mode, which accepts PostgreSQL and Cassandra.
- status routes, used to span metrics by available plugins such as: Prometheus.
- invalid-whoami-2, this is an invalid upstream that illustrates how an upstream operates when there is an unhealth scenario and what metrics are available.
- load balancing, is only used by whoami; other routes use upstreams with only one host and no fault tolerance.
How does the integration of Grafana, Prometheus, and Kong work?
The drawings below show how metrics are translated to Dash and Alerts in Grafana using data that was initially created in Kong and set to Prometheus.
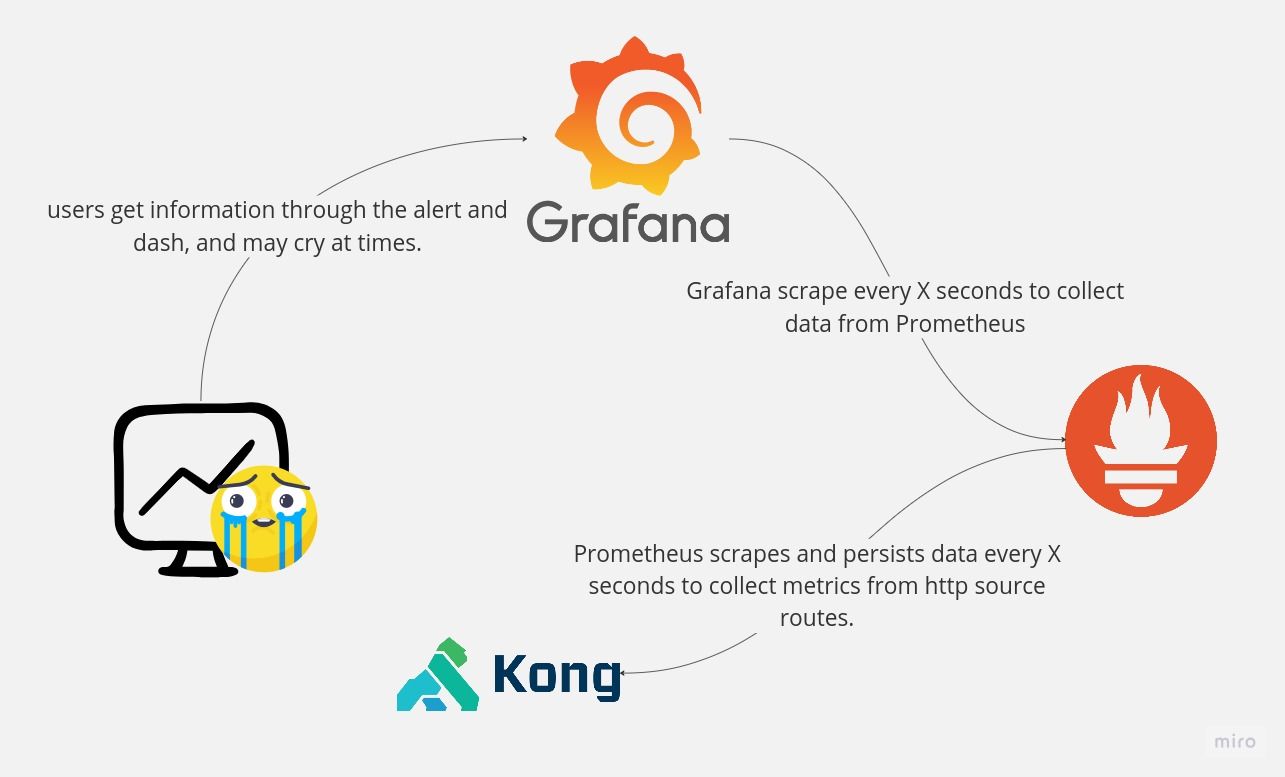
Let's look at the assets files
Please clone this repository; this example contains a lot of files, and I'll go over the important ones.
- kong/kong.yml
This file covers Kong features; only one plugin is used to get metrics for Prometheus; all metrics should be enabled to support every section of the Official Dashboard.
_format_version: "3.0"

plugins:
- name: prometheus
  config:
    status_code_metrics: true
    latency_metrics: true
    bandwidth_metrics: true
    upstream_health_metrics: true

services:
- name: hello
  url: http://local-server
  routes:
  - name: hello
    paths:
    - /

- name: whoami
  url: http://whoami
  routes:
  - name: whoami
    paths:
    - /whoami

- name: coins
  url: https://coins-api/v1/bpi/currentprice.json
  routes:
  - name: coins
    paths:
    - /coins

- name: money
  url: https://money-api/json/all
  routes:
  - name: money
    paths:
    - /money

upstreams:
  - name: coins-api
    targets:
    - target: api.coindesk.com:443

  - name: money-api
    targets:
    - target: economia.awesomeapi.com.br:443

  - name: local-server
    targets:
    - target: nginx:5000

  - name: whoami
    targets:
    - target: whoami:80
      weight: 50
    - target: whoami-2:80
      weight: 50
    - target: invalid-whoami-2:80
      weight: 1
    healthchecks:
      passive:
        healthy:
          http_statuses:
          - 200
          successes: 1
        type: http
        unhealthy:
          http_failures: 5
          http_statuses:
          - 429
          - 500
          - 503
          tcp_failures: 2
          timeouts: 2
- docker-compose.yml
A number of containers will be running concurrently:
- Kong
- Prometheus
- Grafana
- Nginx (local server)
- Traefik Whoami (used for upstream metric generation)
- Seed (used to produce metrics by making queries)
version: '3.8'

x-healthcheck: &defautl-healthcheck
  interval: 10s
  timeout: 3s
  start_period: 1s

services:
  kong:
    image: kong:3.3.1-alpine
    environment:
      KONG_LOG_LEVEL: info
      KONG_ADMIN_ACCESS_LOG: /dev/stdout
      KONG_ADMIN_ERROR_LOG: /dev/stderr
      KONG_DATABASE: "off"
      KONG_DECLARATIVE_CONFIG: /etc/kong/kong.yml
      KONG_STATUS_LISTEN: "0.0.0.0:8100"
      KONG_ADMIN_LISTEN: "0.0.0.0:8001"
    healthcheck:
        <<: *defautl-healthcheck
        test: ["CMD-SHELL", "nc -z -v localhost 8000"]
    ports:
      - "8000:8000"
      - "8001:8001"
      - "8100:8100"
    restart: unless-stopped
    networks:
      - kong-grafana
    volumes:
      - ./kong/kong.yml:/etc/kong/kong.yml
    depends_on:
      - nginx
      - whoami
      - whoami-2

  prometheus:
    image: prom/prometheus
    ports:
      - 9090:9090
    healthcheck:
      <<: *defautl-healthcheck
      test: ["CMD-SHELL", "nc -z -v localhost 9090"]
    volumes:
      - ./prometheus/prometheus.yml:/etc/prometheus/prometheus.yml
    networks:
      - kong-grafana
    depends_on:
      - kong

  grafana:
    image: grafana/grafana
    ports:
      - 9091:9091
    healthcheck:
        <<: *defautl-healthcheck
        test: ["CMD-SHELL", "nc -z -v localhost 9091"]
    volumes:
      - ./grafana/grafana.ini:/etc/grafana/grafana.ini
      - ./grafana/datasource.yaml:/etc/grafana/provisioning/datasources/datasource.yaml
      - grafana-storage:/var/lib/grafana
    networks:
      - kong-grafana
    depends_on:
      - prometheus

  nginx:
    build:
      context: ./
      dockerfile: nginx.Dockerfile
    image: nginx-local-server
    healthcheck:
      <<: *defautl-healthcheck
      test: ["CMD-SHELL", "nginx -t"]
    networks:
      - kong-grafana

  whoami:
    image: traefik/whoami
    environment:
      - WHOAMI_PORT_NUMBER=80
    networks:
      - kong-grafana

  whoami-2:
    image: traefik/whoami
    environment:
      - WHOAMI_PORT_NUMBER=80
    networks:
      - kong-grafana

  seed:
    build:
      context: ./
      dockerfile: seed.Dockerfile
    networks:
      - kong-grafana
    depends_on:
      - kong

volumes:
  grafana-storage:

networks:
  kong-grafana:
    name: "kong-grafana"
- nginx.Dockerfile
A Docker NGINX image that listens on port 5000 and contains some assets.
FROM docker.io/bitnami/nginx:1.25

ENV NGINX_HTTP_PORT_NUMBER=5000

COPY ./assets/nginx /app
- seed.Dockerfile
A Docker Alpine image was used to call API Gateway and generate certain metrics with Apache AB.
FROM alpine:latest

RUN apk add apache2-utils

COPY ./seed/test_apis.sh /test_apis.sh

RUN chmod +x /test_apis.sh

ENTRYPOINT [ "/test_apis.sh" ]
- grafana/datasource.yml
This file describes Grafana's accessible datasources.
apiVersion: 1

datasources:
  - name: Prometheus
    type: prometheus
    url: http://prometheus:9090
- prometheus/prometheus.yml
This file provides Prometheus targets for metric extraction and specifies a global interval for scraping data.
global:
  scrape_interval: 15s

scrape_configs:
  - job_name: 'kong'

    static_configs:
      - targets: ['kong:8100']
You can start containers after cloning the repository; however, ensure sure you are not using the ports specified in the docker-compose file.
docker compose up -d
There is a list of url that you can explorer:
- Hello Route
- Whoami Route
- Coins Route
- Money Route
- Kong Admin url
- Metrics url used by Prometheus
- Prometheus url
- Grafana url
The seed container will execute certain requests to generate data for Grafana; you can do more manually or relaunch the seed container with the following command:
docker compose run --rm seed --env REQUESTS=11
Prometheus metrics format
This is just part of the metrics prometheus format, which is a hash that has multiple keys and values per line; you may see more at http://localhost:8100/metrics.
# HELP kong_bandwidth_bytes Total bandwidth (ingress/egress) throughput in bytes
# TYPE kong_bandwidth_bytes counter
kong_bandwidth_bytes{service="coins",route="coins",direction="egress",consumer=""} 9410
kong_bandwidth_bytes{service="coins",route="coins",direction="ingress",consumer=""} 752
kong_bandwidth_by
tes{service="money",route="money",direction="egress",consumer=""} 20514
kong_bandwidth_bytes{service="money",route="money",direction="ingress",consumer=""} 1128
# HELP kong_datastore_reachable Datastore reachable from Kong, 0 is unreachable
Kong Dashboard
The Grafana dashboard can be accessed via http://localhost:9091/. using such strong default credentials (admin/admin). After signing in, browse to Dashboard > Manager > Import.
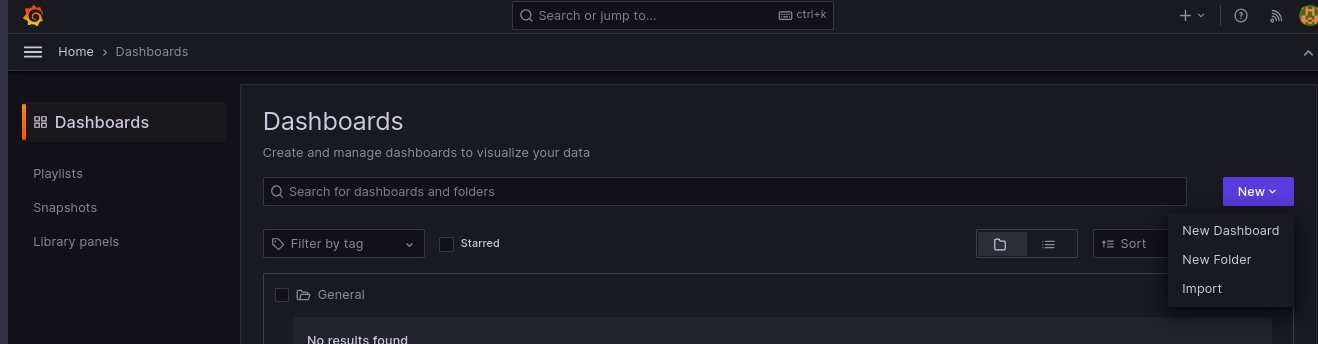
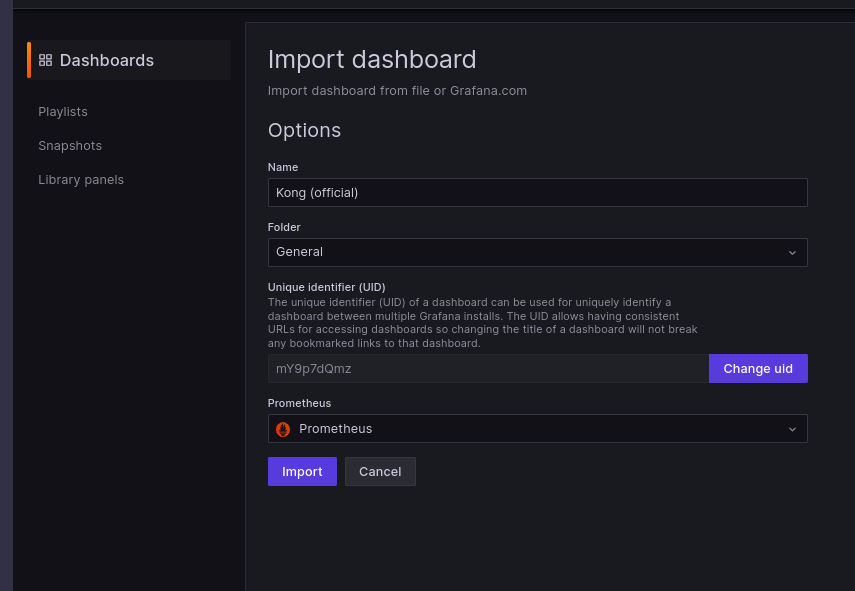
Then import a file from Kong's official dashboard, choose only one Prometheus DataSource, and you can now view the dashboard and metrics.
Alerts
To establish allerts, identify a specific metric and create values for ok, warn, and error, as we do in other tools such as New Relic, DataDog, CloudWatch, and so on. This configuration may be found at http://localhost:9091/alerting.
The image below shows an alert example in which the request count from the kong_http_requests_total metric is used to determine whether Kong is receiving requests.
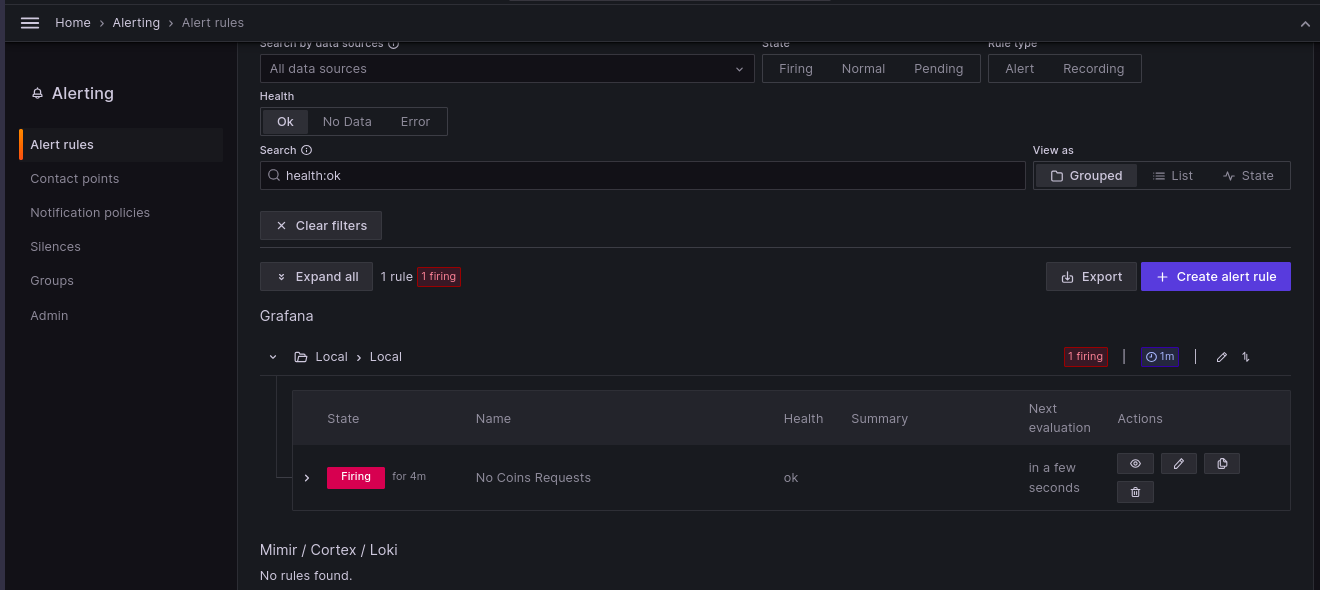
It is normal to receive email alerts, thus to make this function, you must configure smtp settings in the grafana.ini file.
[smtp]
enabled = false
host = localhost:25
user =
# If the password contains # or ; you have to wrap it with triple quotes. Ex """#password;"""
password =
cert_file =
key_file =
skip_verify = false
from_address = [email protected]
from_name = Grafana
ehlo_identity =
startTLS_policy =

[emails]
welcome_email_on_sign_up = false
templates_pattern = emails/*.html
That's all
I hope you found this article useful; I attempted to provide a sandbox for you to begin exploring with metrics while avoiding making assumptions about performance, issues, and migrations.
This post does not cover how to create custom metrics using Prometheus power; rather, we used metrics offered by the Kong Plugin that were Prometheus-specified.
We have several applications and frameworks that generate metrics in Prometheus format, but if you want to produce business metrics, you'll have to get your hands dirty.
You may create a wonderful Dash in Grafana, but don't waste your time before looking at the official Dash.
Keep your dash and kernel 🧠 up to date. God's 🙏🏿 blessings on you.
References
]]>Sério tu vais falar de Windows? Sim, porque não!
Embora eu seja um usuário ativo do Linux, diria que grande parte da minha experiência profissional foi no Windows, para os mais íntimos janelinha...

Meu primeiro contato Windows foi a versão 3.11, meu pai iniciou a carreira de técnico de informática e acabei passando por todas as versões 95, 98, ME. NT, 2000, XP e Vista. Continuo usando o Windows no meu desktop até hoje desde a versão 7, agora estou no Windows 11, mas o penguim🐧 é primogênito em meu notebook.
O problema
Alguns tempo atrás, comprei um NVME M.2 Kingston e decidi instalar a nova versão do Windows 11. Porém, durante a instalação criei uma partição para uso e outra para recuperação, mas faltou a famosa partição de 100MB para EFI. O boot permanceu no SSD antigo. 😬
Este ano fiz um upgrade no PC com alguns tons de Gamer:
- Ryzen 7 5800x, o bicho é 🔥;
- Placa Mãe Asus TUF GAMING;
- NVIDIA RTX 3050;
- 32 GB de RAM;
- Gabinete cheio de leds do jeito que o filhão gosta;
Apesar da atualização, o Windows parece estar engasgando devido à má otimização. Parem de copiar o KDE e melhorem o SO. 😤
Então eu decidi resolver este problema do boot. Já pensou se meu querido SSD decide morrer? Isso traria um trabalho de restauração EFI, que eu gostaria de evitar. Tô sem tempo irmão...

Falando em SSD, meu disco rígido externo WD Elements (WD Blue) aclamado pela crítica morreu depois de quase não ser usado. A falácia de que "Western Digital é melhor que Seagate" não parece se aplicar a mim. Meu Seagate está idoso e lindão no meu PC que passou por vários upgrades. Ambos são utilizados de forma diferentes um interno e outro externo, mas fica registrado minha indignação.
Sem rodeios no artigo! Usei o Mini Tool Partition Wizard, uma ferramenta (gratuita) para Windows que pode redimensionar discos, a minha preferida. Parece ser o sucessor do conhecido Partition Magic. O próprio Gerenciamento de Disco do Windows pode fazer esse redimensionamento, você também pode usar o Disk Genius para esse propósito.
Essas ferramentas permitem que alguns de seus recursos sejam usados gratuitamente, mas também existem recursos pagos "freemium".
Não quero instalar nada no Windows e uso Dual-Boot Linux! O Gparted também faz bem esse trabalho.
Pode ser necessário redimensionar uma ou mais partições em seu disco rígido para deixar 100 MB de espaço não reservado para a nova partição.
Criando a partição
Depois de ter esse espaço não reservado, você pode criar uma partição FAT32 e nomeá-la como EFI. Você deve atribuir à partição uma letra que será necessária para gravar os arquivos de inicialização.
A Microsoft facilitou nossa vida com o bcdboot. Se as partições já foram criadas, você pode facilmente criar toda a estrutura EFI para seu sistema atual com o seguinte comando:
- C:\Windows é o local onde seu sistema operacional foi instalado;
- Z: é um exemplo você deve informar a letra da sua nova unidade EFI
bcdboot C:\Windows /s Z:
Pronto
Depois de criar os arquivos de BOOT necessários, você pode definir uma nova partição do disco rígido como a partição de BOOT primária em sua BIOS. Você poderia deletar a antiga partição EFI depois, mas acho interessante manter os dois locais, vai que!
Deus abenç️️oe 🕊️ uma excelente semana para você! ️Bora manter esse kernel 🧠 atualizado.
Referências
]]>Today I'll teach you how to listen for and emit events using only JavaScript and the DOM. If you are a Web Developer, you may be aware that everything begins with events, such as moving, clicking, and keying, but how about developing your own events to perform your tasks?

Fire a click event
We can emit a click event at any place in the front-end context; let's create a basic page to demonstrate this:
<!DOCTYPE html>
<html lang="en">
  <head>
    <title>Fire a click event</title>
  </head>
  <body>
    <button id="button">Click to subscribe, please! 🙏 (<span>0</span>)</button>
    <script lang="javascript" async>
      const buttonElement = document.getElementById("button")
      let counter = 0

      buttonElement.addEventListener('click', function (event) {
          event.preventDefault()
          counter++
          const counterElement = this.getElementsByTagName("span")[0]
          counterElement.innerText = counter.toString()
      })

      setInterval(() => {
        buttonElement.dispatchEvent(new Event('click'))
      }, 5000)
    </script>
  </body>
</html>
Take a deep breath, Angular, React, and Vue devs, and remember that this is pure and portable Vanilla. Keep cool and relax, I know you like writing your effects, directives, and states. 🤗
In the following example, we have a basic website that forces a person to click against their will, similar to how some ads work 🤑.
- addEventListener, adds a function to listen for element events;
- dispatchEvent, send an event to an element; if the element is not listening, the event is omitted;
Following that is a screencast of how this example works:

Why not create your own events?
We may add an event to a web application, such as a logout event, redirect event, push event, or anything else important to your application or website. If you would like to combine different libraries, you may use DOM power events to accomplish so.
<!DOCTYPE html>
<html lang="en">
  <head>
    <title>Document events</title>
  </head>
  <body>
    <button id="button">Purge Session 🧹</button>
    <script lang="javascript" async>
      document.addEventListener('logout', function () {
        sessionStorage.clear()
        localStorage.clear()

        console.log('Your session has been deleted...')

        document.bgColor = 'tomato'

        setTimeout(() => {
          document.bgColor = '#fff'
        }, 2000)
      })

      const buttonElement = document.getElementById("button")

      buttonElement.addEventListener('click', function (event) {
        event.preventDefault()
        document.dispatchEvent(new Event('logout'))
      })
    </script>
  </body>
</html>
The first time we received an alert box, next messages were sent to the console since the alert function was no longer listening.

Removing an event
Using the following function, we can remove a registered event:
<!DOCTYPE html>
<html lang="en">
  <head>
    <title>RemoveEventListener in action</title>
  </head>
  <body>
    <button id="button">Click one time</button>
    <script lang="javascript" async>
      const buttonElement = document.getElementById('button')
      let counter = 0

      function handleClickAlert(event) {
        event.preventDefault()
        alert('click works!')
        buttonElement.removeEventListener('click', handleClickAlert, false)
      }

      function handleClickSilent(event) {
        event.preventDefault()

        counter++
        console.log(`click works ${counter}!`)
      }

      buttonElement.addEventListener('click', handleClickSilent)
      buttonElement.addEventListener('click', handleClickAlert)
    </script>
  </body>
</html>
Because we can add multiple listeners, we must specify which function should be removed. The first time we received an alert box, next messages were sent to the console since the alert function was no longer listening.
That's all
Previous examples is designed to works with the most recent browser; if you use Internet Explorer 6, something may not work properly. 🤭
Sometimes DOM Events are all we need to integrate things; multiple frameworks handle the work of listening for and emitting events, but it's crucial to understand how things function without the library and packages. That is my only objective in writing this post.
Keep your kernel 🧠 up to date. God's 🙏🏿 blessings on you.
]]>In this post, I'll show you how to use the HEALTHCHECK command to verify if your container runs properly.
If you haven't already, I strongly suggest you read the previous post about Docker build and push:

HEALTHCHECK command
The command tells you how to check if your container is operational. Running for you might mean running a background process, listening on a UDP, TCP, or HTTP port, or checking for an accessible file; there are several approaches to ensure your container is in good health. The next line explains command syntax:
HEALTHCHECK --start-period={seconds} \
  --retries={number} \
  --interval={seconds} \
  --timeout={seconds} \
  CMD {command}
| Option | Description |
|---|---|
| start-period | Defines a time frame in which to start the healthcheck process, which is essential when you have a delayed application, such as Monolithic web applications. |
| retries | Sets the number of times a healthcheck will be run after an unsuccessful attempt to set the container to unhealthy. |
| timeout | Defines a time limit for evaluating the healthcheck command. |
| interval | Sets the amount of time to wait before performing the healthcheck command. Healhcheck always runs a command once the container starts up. |
| command | We may use shell commands (for example, curl, nc, grep) or bash scripts to ensure that your container is working. |
Building an image using health check
The Docker image below specifies a Redis database with a time frame of 10 seconds to start, listening on the default Redis TCP port 6379 after the time frame has been set. Redis allows you to check that the server is up and running by sending a PING message and receiving a PONG response, which is fantastic.

FROM redis:latest

RUN printf "sleep 10\n" > /usr/local/bin/redis-server-delayed
RUN printf "redis-server" >> /usr/local/bin/redis-server-delayed

RUN chmod +x /usr/local/bin/redis-server-delayed

HEALTHCHECK --interval=10s --timeout=3s \
  --start-period=1s --retries=10 \
  CMD redis-cli ping | grep PONG

CMD ["redis-server-delayed"]
Delay Redis magic🪄 is created by using the sleep command by making the entrypoint wait 10 seconds before starting Redis with the command redis-server. 😆
It's time to build a new container image and watch how health check works.
docker build -t test-healthcheck -f Dockerfile .
Let's start a fresh container in detached mode with a named image called "test-healthcheck.".
docker run -d --rm --name redis-test test-healthcheck

# the heatlh stats should be starting
docker container ls --filter name=redis-test

# after 10 seconds, the container begins to perform the healthcheck command; let us wait another 2 seconds to get a healthy status.
sleep 12
docker container ls --filter name=redis-test
The command execution is shown in the screencast below:
Nice! As you can see, the script check twice to show you the container's health condition, starting and becoming healthy.
A health check real world example
Following is a health check for RabbitMQ, which checks HTTP port 15672 and TCP port 5672. Once both ports begin listening, the container will be identified as healthy.
FROM bitnami/rabbitmq:latest as base

USER root

RUN apt update && apt install -y netcat

RUN apt-get clean autoclean && \
    apt-get autoremove --yes && \
    rm -rf /var/lib/{apt,dpkg,cache,log}/

FROM base as run

USER 1001

ENV RABBITMQ_NODE_PORT_NUMBER=5672
ENV RABBITMQ_MANAGEMENT_PORT_NUMBER=8080

HEALTHCHECK --interval=3s --timeout=3s --start-period=10s --retries=10 \
  CMD curl --fail http://localhost:$RABBITMQ_MANAGEMENT_PORT_NUMBER && \
      nc -z -v localhost $RABBITMQ_NODE_PORT_NUMBER
You can run this image as before using the following command:
docker build -t test-healthcheck-web -f Dockerfile .

docker run -d --rm --name rabbitmq test-healthcheck-web

sleep 15
docker container ls --filter name=rabbitmq

docker stop rabbitmq
At last, you may add health check directly to docker compose, changing the Docker Image specification, or in your Kubernetes yaml file, as seen below:
version: '3.8'

name: test-healthcheck

services:
    slow-redis:
      image: redis
      entrypoint: /bin/sh
      command: -c "sleep 30 && redis-server"
      healthcheck:
        test: ["CMD-SHELL", "redis-cli ping | grep PONG"]
        interval: 10s
        timeout: 3s
        start_period: 1s
Final thoughts
More can be found on my Github repository. For build images, I made many mixed examples.
If you utilize a container image without a health check defined, I recommend looking at the preinstalled packages. Curl and wget can be used to test HTTP connections, while nc may be used to test TCP or UDP connections, as previously shown.
For databases, you may do a connection test with invalid credentials to see whether the database is viable and accepting authentications; this is my approach, and I never use authentic credentials. 😉
There are several ways to guarantee that your container is working. If you don't, you can have trouble scaling or switching containers when utilizing Docker Swarm, Kubernetes, or PaaS solutions. Old containers will be replaced with new ones, resulting in a small or big interruption in service and time is money...

That's it for now; install kernel 🧠 patches and keep this updated. God's blessings 🙏🏿.
References
]]>This article is for those who want to learn about the ELK stack, specifically how Elasticsearch, LogStash, and Kibana communicate and what each project's responsibilities are.
When I decided to explore Elasticsearch a few years back, I was amazed with its capabilities; with the well-documented API, I had no trouble indexing my hello world documents. I was working with Apache Solr and Lucene at the time, and I recall having some trouble comprehending this stack, which was also hard to install locally. When I was comparing Elasticsearch, Solr, and Sphinx, I read that Elasticsearch indexes documents more faster than Solr + Lucene. Then I thought, huh, interesting. I encourage you do this, not to criticize projects, but to understand where the projects are suitable.
Elasticsearch
Is a distributed, free, and open search and analytics engine that can handle textual, numerical, geographic, structured, and unstructured data. Is built on Apache Lucene and is written in Java and has official client support in Java, C#, Ruby, Python, and PHP. It is essential to know that you can use API to manage documents when there is no official client.
When full-text search resources are not appropriate for your project, Elasticsearch comes to play.
LogStash
Is a free and open server-side data processing pipeline that collects data from many sources, transforms it, and then sends it to your chosen "stash."
It might be difficult to develop and manage workers and schedulers to handle document updates, therefore LogStash allows us to send data to any destination, for example, you can import document updates from files and send to Elasticsearch, or import data from RabbitMQ and send to Elasticsearch.
You can use any approach to keep your cluster healthy and scalable ❤️.
Kibana
Is a free and open-source frontend application that runs on top of the Elastic Stack and provides search and data visualization features for Elasticsearch-indexed data. Also known as the Elastic Stack charting tool.
Stack
Okay! Show me the stack in running, please.
We can manually install this stack...

Sorry, but containers are the greatest way to learn and keep things up to date. Remember that adding more languages, frameworks, and containers will result in new vulnerabilities; there is no gain without pain. So, my advise is to make things simple to test and update.
Let's get started with the docker compose file, with some containers and asset.
- docker-compose.yml
version: '3.8'

name: elk

services:
  fake-logger:
    image: willsenabr/fake-logger
    logging:
      driver: gelf
      options:
        tag: dev
        gelf-address: udp://localhost:12201
    environment:
      DELAY: 1000
    depends_on:
      - logstash

  elasticsearch:
    image: bitnami/elasticsearch:8
    ports:
      - 9200:9200
    volumes:
      - elasticsearch-data:/bitnami/elasticsearch/data
    environment:
        discovery.type: single-node
        ELASTICSEARCH_PORT_NUMBER: 9200
        ELASTICSEARCH_CLUSTER_NAME: docker-elk
        ES_JAVA_OPTS: -Xms512m -Xmx512m

  logstash:
    image: bitnami/logstash:7
    ports:
      - "12201:12201/udp"
      - "5044:5044"
    environment:
      LOGSTASH_PIPELINE_CONF_FILENAME: "logstash_docker.conf"
    volumes:
      - ./assets/logstash/pipeline:/bitnami/logstash/pipeline
    depends_on:
      - elasticsearch

  kibana:
    image: bitnami/kibana:7
    ports:
      - 5601:5601
    environment:
      - KIBANA_ELASTICSEARCH_URL=elasticsearch
    volumes:
      - kibana-data:/bitnami/kibana
    depends_on:
      - elasticsearch

volumes:
  elasticsearch-data:
  kibana-data:

networks:
  default:
    name: elk
The compose file defines containers that function on the same network as "elk" and have persistent volumes, such as Elasticsearch and Kibana. The most significant parameters is container fake-logger, which changes the default docker logs to Graylog Extended Format (Gelf) instead default file.
- fake-logger, generates data for LogStash by writing random logs to stdout and utilizing the loggin driver Graylog Extended Format (Gelf), which sends logs via UDP. I built this Elixir application, and you can find out more about it on my Github repository;
- elasticsearch, container listening on TCP port 9200 by default;
- logstash, container listing ports 5044, 12201 (gelf port) The plugin logstash-gelf listens on this port;
- kibana, container listening on HTTP port 5601 by default, UI that translates ElasticSearch-indexes to data visualization, such as Dashboards;
- ./assets/logstash/pipeline/logstash_docker.conf
input {
  gelf {
    id => "docker_gelf_plugin"
    type => docker
    host => "0.0.0.0"
  }
}

output {
  stdout {}
  elasticsearch {
    hosts => ["http://elasticsearch:9200"]
    index => "docker"
  }
}
The LogStash setup pipeline specifies a Greylog Extended Format (Gelf) input with LogStash plugin support and an Elasticsearch index named docker output.
Simply put, fake-logger sends logs to LogStash, LogStash sends logs to Elasticsearch, and Kibana provides data visualization.
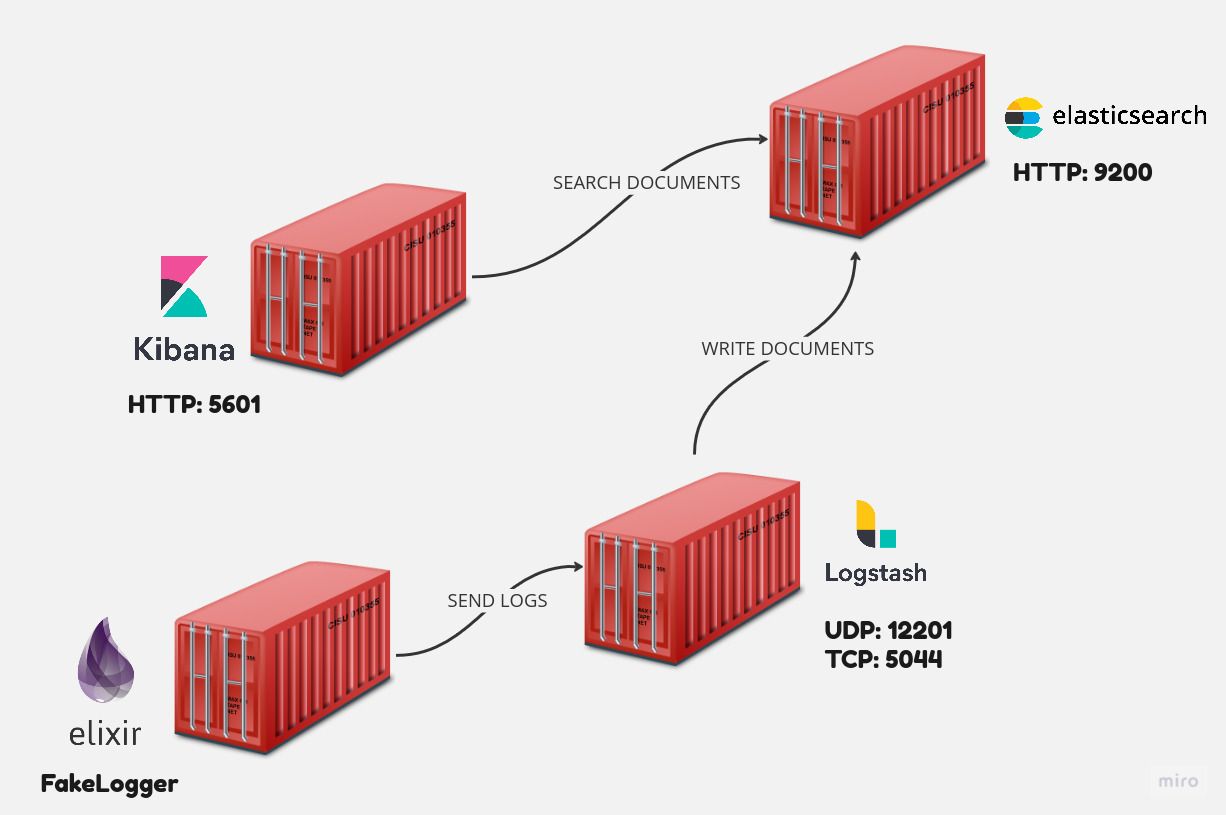
Running containers
It's time to start running containers with the following command:
docker compose up -d
Wait for the containers to be up and running and enjoy some coffee ☕.
Now we need to look at the LogStash logs and configure the Elastisearch index pattern in Kibana.
docker compose logs logstash -f
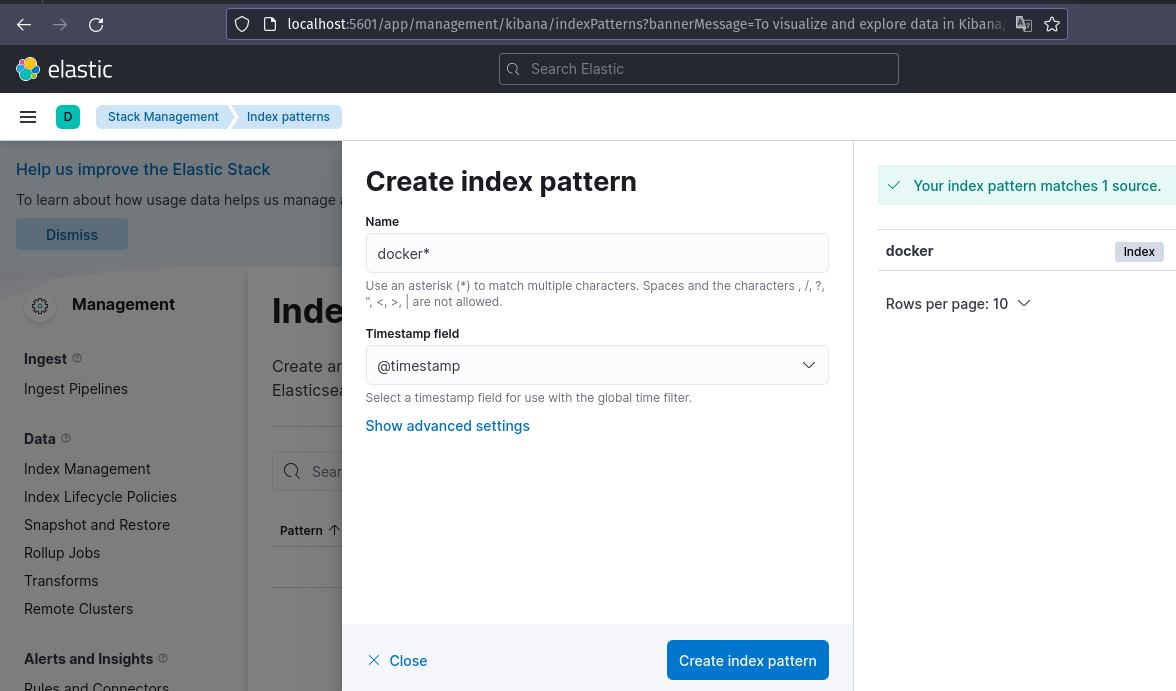
Kibana may be accessed at http://localhost:5601. Set the name of the index to docker*.
Following these settings, you may discover expected logs in Kibana discovery.
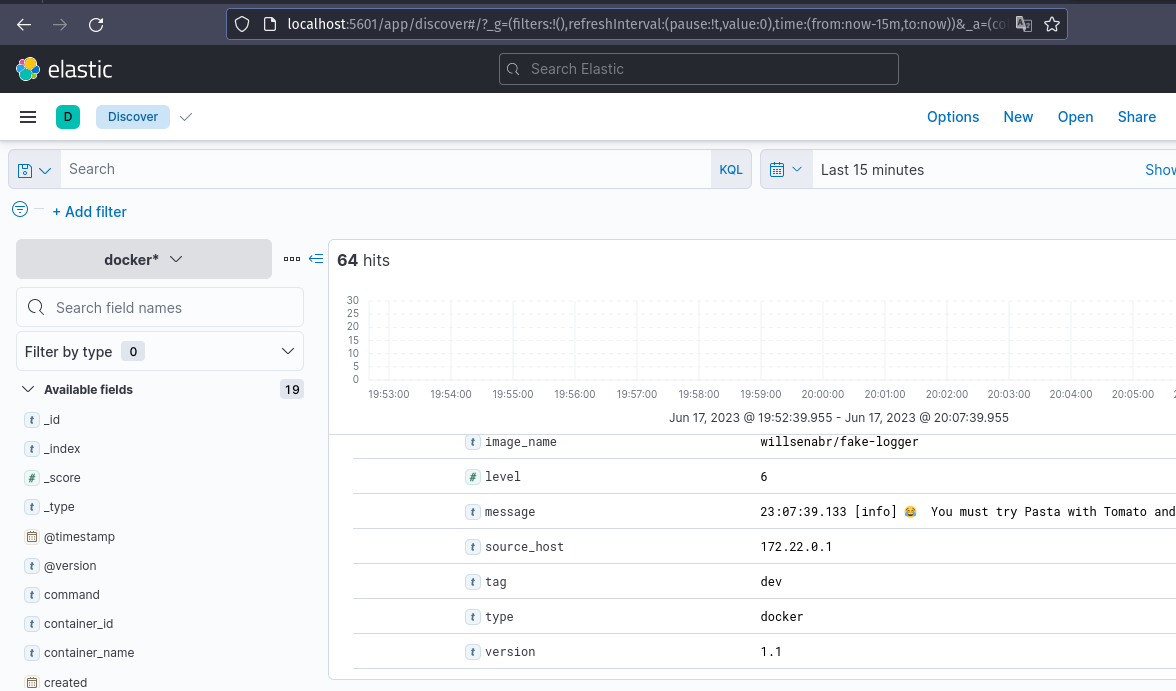
This is an option if accessible log services like DataDog Services, Cloud Watch, Papertrail, Logly, and a hundred other options are not low-cost for your Cloud.
Elasticsearch API
LogStash is in charge of receiving input data and sending it to Elasticsearch, however we handle this directly to the API using an Elasticsearch Client. I will show how to send a document to Elasticsearch. It important to note that we do not configure any indexes; this topic may be relevant to a future piece on Elasticsearch features.
List all indices
curl --location 'http://localhost:9200/_cat/indices'
Create document
curl --location 'http://localhost:9200/docker/_doc' \
--header 'Content-Type: application/json' \
--data-raw '{
    "@timestamp": "2099-01-01T00:00:00",
    "type": "docker",
    "message": "Bar message",
    "command": "/home/foo/bar"
}'
Search documents
curl --location 'http://localhost:9200/docker/_search' \
--header 'Content-Type: application/json' \
--data '{
  "query": {
    "bool": {
      "filter": [
        { "term": { "type": "docker"   }}
      ]
    }
  }
}'
Get, update and delete document by ID
Remember to change the DOCUMENT_ID.
GET
curl --location 'http://localhost:9200/docker/_doc/DOCUMENT_ID'
UPDATE
curl --location --request PUT 'http://localhost:9200/docker/_doc/DOCUMENT_ID' \
--header 'Content-Type: application/json' \
--data '{
    "type": "docker",
    "message": "Bar message2",
    "command": "/home/foo/bar"
}'
DELETE
curl --location --request DELETE 'http://localhost:9200/docker/_doc/DOCUMENT_ID'
More features may be found at Elasticsearch Index API.
Next steps
You may get the source code from my Github repository.
I didn't include FileBeat, which was built by the ELK team, but it may be used in place of LogStash in certain cases. In general, Filebeat uses less RAM than LogStash but has fewer input plugins, therefore both solutions might be used to deliver documents to ElasticSearch or any target, but you must decide which matches your project best.
Today I'll show you how to utilize ELK in practice by employing all of the letters in the acronym. That's all for now; please leave your thoughts and suggestions so that I may better my future posts.
Have a nice day, and keep your kernel 🧠 up to date. God's 🙏🏿 blessings on you.
References
]]>When containers were introduced into the game, container images with the user root were often used. Today, it is much better than in the past, but the problem persists, so we need to build an appropriate custom-based image and define a user to execute processes, to avoid security problems and limits application portability.
In this post, we'll look at how to establish a user without root privileges and use it to execute container processes. It's essential to keep in mind that when we made these changes, we faced additional challenges, such as permissions. Root can handle anything, but normal and mortal users cannot!

If you haven't already, I strongly suggest you read the previous post about Docker build and push:
USER instruction
The following Dockerfile begins with root installing some Alpine packages before adding a user called foo to handle the process. Please, no spells! The whoami command displays the current user.
FROM alpine:3.17

WORKDIR /app

USER root

RUN apk --update add curl

RUN adduser -D foo

USER foo

ENTRYPOINT ["whoami"]
- USER root, specifies that the user root will handle all following instructions;
- USER foo, specifies that the user foo will handle all following instructions, so entrypoint will be handled by foo user.
The following command will build a run container.
docker build -t foo-user -f Dockerfile .
docker run -it --rm foo-user
We could come into some challenges! For example, if you have files or directories shared between the host and containers, you should preserve the same UID:GID between them to avoid "hijacking files". If the host or container changes something in the shared context, the user and group will be applied based on where the process is running. As a result, it is critical to maintain the same (UID) and (GID). I published an article on the subject:

More challenges
It is crucial to understand that adduser is a command that may change in syntax according on the Linux distribution used, such as Arch, Debian, RHEL, and others. If we need to utilize usermod as in Debian distros, Alpine should have package shadow installed.
Change user to run the process may be tough but at my workplace, it's common, employ chmod and chown to ensure rights to user responsible for running process and to fix vulnerability container image scanners.
I enjoy using Bitnami container images and recommend that you do as well. They are actively working to remove all root users from any container image in the world, and the container images are routinely updated.
Final thoughts
More can be found on my Github repository. For build images, I made many mixed examples.
In this post, I showed how to build a basic container image without root privileges by utilizing the Dockerfile instruction USER.
Your kernel has already been upgraded; keep your code simple, and God bless 🙏🏿 you.
]]>